Jordanian vs Immigrants from Trinidad and Tobago 3 or more Vehicles in Household
COMPARE
Jordanian
Immigrants from Trinidad and Tobago
3 or more Vehicles in Household
3 or more Vehicles in Household Comparison
Jordanians
Immigrants from Trinidad and Tobago
20.1%
3 OR MORE VEHICLES IN HOUSEHOLD
84.4/ 100
METRIC RATING
142nd/ 347
METRIC RANK
13.3%
3 OR MORE VEHICLES IN HOUSEHOLD
0.0/ 100
METRIC RATING
335th/ 347
METRIC RANK
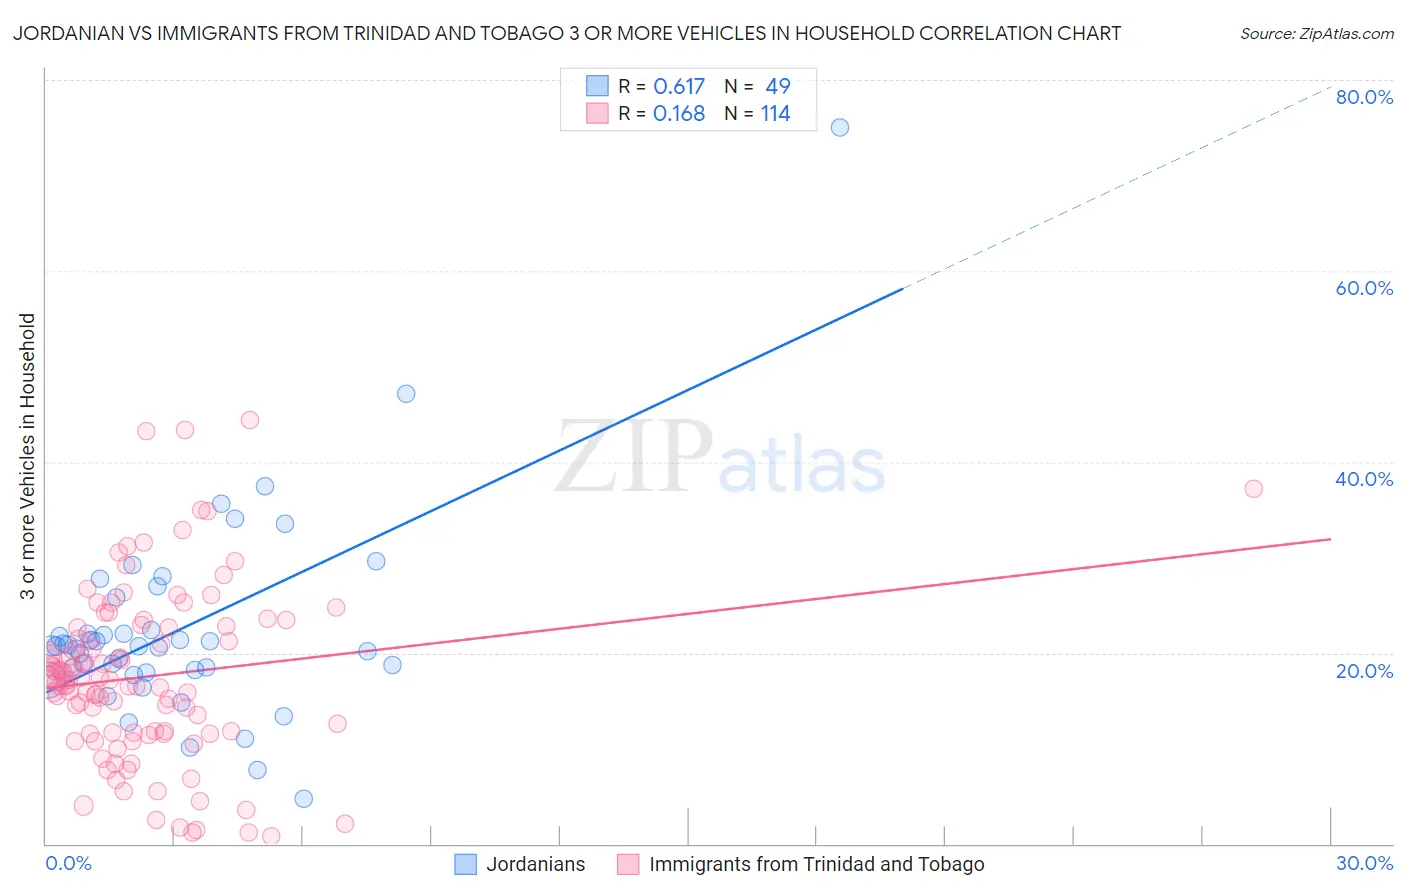
Jordanian vs Immigrants from Trinidad and Tobago 3 or more Vehicles in Household Correlation Chart
The statistical analysis conducted on geographies consisting of 166,358,031 people shows a significant positive correlation between the proportion of Jordanians and percentage of households with 3 or more vehicles available in the United States with a correlation coefficient (R) of 0.617 and weighted average of 20.1%. Similarly, the statistical analysis conducted on geographies consisting of 223,458,763 people shows a poor positive correlation between the proportion of Immigrants from Trinidad and Tobago and percentage of households with 3 or more vehicles available in the United States with a correlation coefficient (R) of 0.168 and weighted average of 13.3%, a difference of 50.8%.
3 or more Vehicles in Household Correlation Summary
| Measurement | Jordanian | Immigrants from Trinidad and Tobago |
| Minimum | 4.7% | 0.77% |
| Maximum | 75.0% | 44.4% |
| Range | 70.3% | 43.6% |
| Mean | 22.4% | 17.5% |
| Median | 20.7% | 17.1% |
| Interquartile 25% (IQ1) | 18.0% | 11.6% |
| Interquartile 75% (IQ3) | 24.1% | 22.7% |
| Interquartile Range (IQR) | 6.0% | 11.0% |
| Standard Deviation (Sample) | 10.8% | 9.0% |
| Standard Deviation (Population) | 10.7% | 9.0% |
Similar Demographics by 3 or more Vehicles in Household
Demographics Similar to Jordanians by 3 or more Vehicles in Household
In terms of 3 or more vehicles in household, the demographic groups most similar to Jordanians are Lithuanian (20.1%, a difference of 0.0%), Ottawa (20.1%, a difference of 0.060%), Iranian (20.1%, a difference of 0.060%), Palestinian (20.1%, a difference of 0.070%), and Australian (20.1%, a difference of 0.11%).
| Demographics | Rating | Rank | 3 or more Vehicles in Household |
| Immigrants | India | 87.2 /100 | #135 | Excellent 20.2% |
| Immigrants | Nicaragua | 87.1 /100 | #136 | Excellent 20.2% |
| Immigrants | Iraq | 87.1 /100 | #137 | Excellent 20.2% |
| Aleuts | 86.3 /100 | #138 | Excellent 20.2% |
| Slovenes | 85.5 /100 | #139 | Excellent 20.2% |
| French American Indians | 85.3 /100 | #140 | Excellent 20.1% |
| Ottawa | 84.9 /100 | #141 | Excellent 20.1% |
| Jordanians | 84.4 /100 | #142 | Excellent 20.1% |
| Lithuanians | 84.4 /100 | #143 | Excellent 20.1% |
| Iranians | 84.0 /100 | #144 | Excellent 20.1% |
| Palestinians | 83.9 /100 | #145 | Excellent 20.1% |
| Australians | 83.6 /100 | #146 | Excellent 20.1% |
| Slovaks | 83.0 /100 | #147 | Excellent 20.1% |
| Guatemalans | 82.6 /100 | #148 | Excellent 20.1% |
| Immigrants | Iran | 80.9 /100 | #149 | Excellent 20.0% |
Demographics Similar to Immigrants from Trinidad and Tobago by 3 or more Vehicles in Household
In terms of 3 or more vehicles in household, the demographic groups most similar to Immigrants from Trinidad and Tobago are Immigrants from Ecuador (13.4%, a difference of 0.46%), Immigrants from Cabo Verde (13.6%, a difference of 1.7%), Trinidadian and Tobagonian (13.6%, a difference of 2.1%), Immigrants from Dominica (13.7%, a difference of 2.8%), and West Indian (13.7%, a difference of 3.0%).
| Demographics | Rating | Rank | 3 or more Vehicles in Household |
| Immigrants | Albania | 0.0 /100 | #328 | Tragic 14.0% |
| Immigrants | Senegal | 0.0 /100 | #329 | Tragic 13.8% |
| West Indians | 0.0 /100 | #330 | Tragic 13.7% |
| Immigrants | Dominica | 0.0 /100 | #331 | Tragic 13.7% |
| Trinidadians and Tobagonians | 0.0 /100 | #332 | Tragic 13.6% |
| Immigrants | Cabo Verde | 0.0 /100 | #333 | Tragic 13.6% |
| Immigrants | Ecuador | 0.0 /100 | #334 | Tragic 13.4% |
| Immigrants | Trinidad and Tobago | 0.0 /100 | #335 | Tragic 13.3% |
| Barbadians | 0.0 /100 | #336 | Tragic 12.6% |
| Immigrants | Bangladesh | 0.0 /100 | #337 | Tragic 12.5% |
| Vietnamese | 0.0 /100 | #338 | Tragic 12.5% |
| Immigrants | Uzbekistan | 0.0 /100 | #339 | Tragic 12.0% |
| Immigrants | Barbados | 0.0 /100 | #340 | Tragic 11.7% |
| Guyanese | 0.0 /100 | #341 | Tragic 11.5% |
| British West Indians | 0.0 /100 | #342 | Tragic 11.4% |