Immigrants from Yemen vs Immigrants from Belgium No Vehicles in Household
COMPARE
Immigrants from Yemen
Immigrants from Belgium
No Vehicles in Household
No Vehicles in Household Comparison
Immigrants from Yemen
Immigrants from Belgium
19.5%
NO VEHICLES IN HOUSEHOLD
0.0/ 100
METRIC RATING
323rd/ 347
METRIC RANK
11.8%
NO VEHICLES IN HOUSEHOLD
1.9/ 100
METRIC RATING
248th/ 347
METRIC RANK
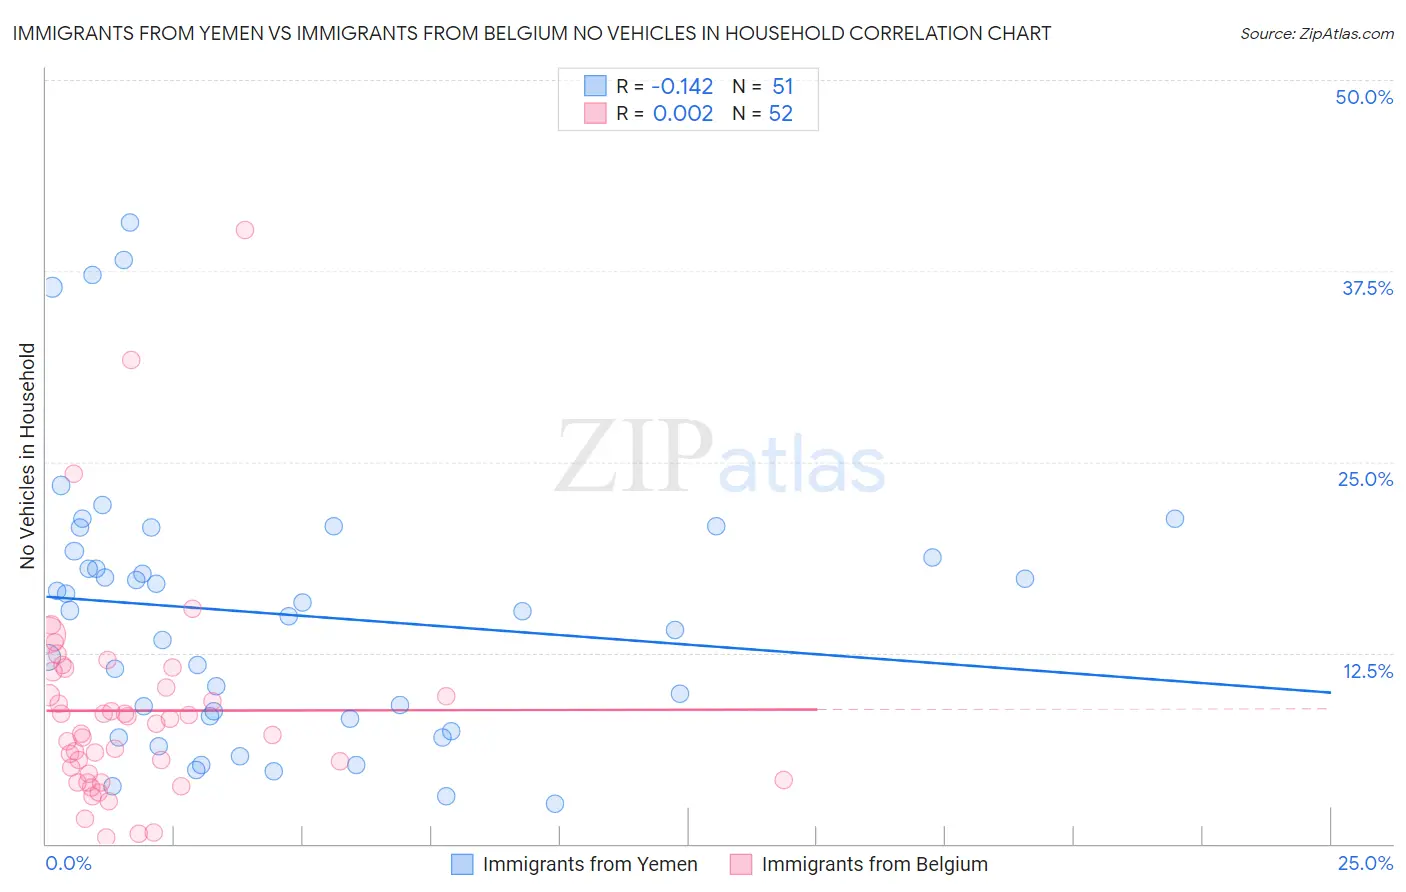
Immigrants from Yemen vs Immigrants from Belgium No Vehicles in Household Correlation Chart
The statistical analysis conducted on geographies consisting of 82,433,611 people shows a poor negative correlation between the proportion of Immigrants from Yemen and percentage of households with no vehicle available in the United States with a correlation coefficient (R) of -0.142 and weighted average of 19.5%. Similarly, the statistical analysis conducted on geographies consisting of 146,599,781 people shows no correlation between the proportion of Immigrants from Belgium and percentage of households with no vehicle available in the United States with a correlation coefficient (R) of 0.002 and weighted average of 11.8%, a difference of 65.2%.
No Vehicles in Household Correlation Summary
| Measurement | Immigrants from Yemen | Immigrants from Belgium |
| Minimum | 2.6% | 0.44% |
| Maximum | 40.7% | 40.2% |
| Range | 38.1% | 39.7% |
| Mean | 15.0% | 8.7% |
| Median | 15.2% | 7.5% |
| Interquartile 25% (IQ1) | 8.2% | 4.4% |
| Interquartile 75% (IQ3) | 19.2% | 10.8% |
| Interquartile Range (IQR) | 11.0% | 6.3% |
| Standard Deviation (Sample) | 9.0% | 7.0% |
| Standard Deviation (Population) | 8.9% | 7.0% |
Similar Demographics by No Vehicles in Household
Demographics Similar to Immigrants from Yemen by No Vehicles in Household
In terms of no vehicles in household, the demographic groups most similar to Immigrants from Yemen are Immigrants from Caribbean (19.6%, a difference of 0.73%), Senegalese (19.8%, a difference of 1.5%), Immigrants from West Indies (20.5%, a difference of 5.5%), Immigrants from Cabo Verde (18.4%, a difference of 5.6%), and Jamaican (17.9%, a difference of 8.6%).
| Demographics | Rating | Rank | No Vehicles in Household |
| Ghanaians | 0.0 /100 | #316 | Tragic 16.4% |
| Immigrants | Ghana | 0.0 /100 | #317 | Tragic 16.6% |
| Immigrants | Belarus | 0.0 /100 | #318 | Tragic 16.7% |
| Alaska Natives | 0.0 /100 | #319 | Tragic 17.4% |
| Soviet Union | 0.0 /100 | #320 | Tragic 17.4% |
| Jamaicans | 0.0 /100 | #321 | Tragic 17.9% |
| Immigrants | Cabo Verde | 0.0 /100 | #322 | Tragic 18.4% |
| Immigrants | Yemen | 0.0 /100 | #323 | Tragic 19.5% |
| Immigrants | Caribbean | 0.0 /100 | #324 | Tragic 19.6% |
| Senegalese | 0.0 /100 | #325 | Tragic 19.8% |
| Immigrants | West Indies | 0.0 /100 | #326 | Tragic 20.5% |
| Immigrants | Senegal | 0.0 /100 | #327 | Tragic 21.1% |
| Immigrants | Dominica | 0.0 /100 | #328 | Tragic 22.2% |
| Ecuadorians | 0.0 /100 | #329 | Tragic 22.8% |
| West Indians | 0.0 /100 | #330 | Tragic 23.7% |
Demographics Similar to Immigrants from Belgium by No Vehicles in Household
In terms of no vehicles in household, the demographic groups most similar to Immigrants from Belgium are Immigrants from Czechoslovakia (11.8%, a difference of 0.010%), Immigrants from Nigeria (11.8%, a difference of 0.030%), Menominee (11.8%, a difference of 0.060%), Immigrants from Honduras (11.8%, a difference of 0.23%), and Paiute (11.8%, a difference of 0.26%).
| Demographics | Rating | Rank | No Vehicles in Household |
| Eastern Europeans | 2.7 /100 | #241 | Tragic 11.7% |
| Turks | 2.6 /100 | #242 | Tragic 11.7% |
| Cheyenne | 2.4 /100 | #243 | Tragic 11.7% |
| Immigrants | Portugal | 2.2 /100 | #244 | Tragic 11.7% |
| Immigrants | Honduras | 2.1 /100 | #245 | Tragic 11.8% |
| Menominee | 2.0 /100 | #246 | Tragic 11.8% |
| Immigrants | Czechoslovakia | 2.0 /100 | #247 | Tragic 11.8% |
| Immigrants | Belgium | 1.9 /100 | #248 | Tragic 11.8% |
| Immigrants | Nigeria | 1.9 /100 | #249 | Tragic 11.8% |
| Paiute | 1.8 /100 | #250 | Tragic 11.8% |
| Blacks/African Americans | 1.6 /100 | #251 | Tragic 11.9% |
| Immigrants | Serbia | 1.5 /100 | #252 | Tragic 11.9% |
| Egyptians | 1.4 /100 | #253 | Tragic 11.9% |
| Immigrants | Uruguay | 1.3 /100 | #254 | Tragic 11.9% |
| Hondurans | 1.2 /100 | #255 | Tragic 12.0% |