Immigrants from Western Africa vs Immigrants from Italy No Vehicles in Household

COMPARE

Immigrants from Western Africa
Race
Ancestry
AfghanAfricanAlaska NativeAlaskan AthabascanAlbanianAleutAlsatianAmericanApacheArabArapahoArgentineanArmenianAssyrian/Chaldean/SyriacAustralianAustrianBahamianBangladeshiBarbadianBasqueBelgianBelizeanBermudanBhutaneseBlackfeetBolivianBrazilianBritishBritish West IndianBulgarianBurmeseCajunCambodianCanadianCape VerdeanCarpatho RusynCelticCentral AmericanCentral American IndianCherokeeCheyenneChickasawChileanChineseChippewaChoctawColombianColvilleComancheCosta RicanCreeCreekCroatianCrowCubanCypriotCzechCzechoslovakianDanishDelawareDominicanDutchDutch West IndianEastern EuropeanEcuadorianEgyptianEnglishEstonianEthiopianEuropeanFijianFilipinoFinnishFrenchFrench American IndianFrench CanadianGermanGerman RussianGhanaianGreekGuamanian/ChamorroGuatemalanGuyaneseHaitianHmongHonduranHopiHoumaHungarianIcelanderIndian (Asian)IndonesianInupiatIranianIraqiIrishIroquoisIsraeliItalianJamaicanJapaneseJordanianKenyanKiowaKoreanLaotianLatvianLebaneseLiberianLithuanianLumbeeLuxembourgerMacedonianMalaysianMalteseMarshalleseMenomineeMexicanMexican American IndianMongolianMoroccanNative HawaiianNavajoNepaleseNew ZealanderNicaraguanNigerianNorthern EuropeanNorwegianOkinawanOsageOttawaPaiutePakistaniPalestinianPanamanianParaguayanPennsylvania GermanPeruvianPimaPolishPortuguesePotawatomiPuebloPuerto RicanPuget Sound SalishRomanianRussianSalvadoranSamoanScandinavianScotch-IrishScottishSeminoleSenegaleseSerbianShoshoneSierra LeoneanSiouxSlavicSlovakSloveneSomaliSouth AfricanSouth AmericanSouth American IndianSoviet UnionSpaniardSpanishSpanish AmericanSpanish American IndianSri LankanSubsaharan AfricanSudaneseSwedishSwissSyrianTaiwaneseThaiTlingit-HaidaTohono O'OdhamTonganTrinidadian and TobagonianTsimshianTurkishU.S. Virgin IslanderUgandanUkrainianUruguayanUteVenezuelanVietnameseWelshWest IndianYakamaYaquiYugoslavianYumanYup'ikZimbabwean
Immigration
NonimmigrantsImmigrantsAfghanistanAfricaAlbaniaArgentinaArmeniaAsiaAustraliaAustriaBahamasBangladeshBarbadosBelarusBelgiumBelizeBoliviaBosnia and HerzegovinaBrazilBulgariaBurma/MyanmarCabo VerdeCambodiaCameroonCanadaCaribbeanCentral AmericaChileChinaColombiaCongoCosta RicaCroatiaCubaCzechoslovakiaDenmarkDominicaDominican RepublicEastern AfricaEastern AsiaEastern EuropeEcuadorEgyptEl SalvadorEnglandEritreaEthiopiaEuropeFijiFranceGermanyGhanaGreeceGrenadaGuatemalaGuyanaHaitiHondurasHong KongHungaryIndiaIndonesiaIranIraqIrelandIsraelJamaicaJapanJordanKazakhstanKenyaKoreaKuwaitLaosLatin AmericaLatviaLebanonLiberiaLithuaniaMalaysiaMexicoMicronesiaMiddle AfricaMoldovaMoroccoNepalNetherlandsNicaraguaNigeriaNorth AmericaNorth MacedoniaNorthern AfricaNorthern EuropeNorwayOceaniaPakistanPanamaPeruPhilippinesPolandPortugalRomaniaRussiaSaudi ArabiaScotlandSenegalSerbiaSierra LeoneSingaporeSomaliaSouth AfricaSouth AmericaSouth Central AsiaSouth Eastern AsiaSouthern EuropeSpainSri LankaSt. Vincent and the GrenadinesSudanSwedenSwitzerlandSyriaTaiwanThailandTrinidad and TobagoTurkeyUgandaUkraineUruguayUzbekistanVenezuelaVietnamWest IndiesWestern AfricaWestern AsiaWestern EuropeYemenZaireZimbabweAzores
Immigrants from Italy
Race
Ancestry
AfghanAfricanAlaska NativeAlaskan AthabascanAlbanianAleutAlsatianAmericanApacheArabArapahoArgentineanArmenianAssyrian/Chaldean/SyriacAustralianAustrianBahamianBangladeshiBarbadianBasqueBelgianBelizeanBermudanBhutaneseBlackfeetBolivianBrazilianBritishBritish West IndianBulgarianBurmeseCajunCambodianCanadianCape VerdeanCarpatho RusynCelticCentral AmericanCentral American IndianCherokeeCheyenneChickasawChileanChineseChippewaChoctawColombianColvilleComancheCosta RicanCreeCreekCroatianCrowCubanCypriotCzechCzechoslovakianDanishDelawareDominicanDutchDutch West IndianEastern EuropeanEcuadorianEgyptianEnglishEstonianEthiopianEuropeanFijianFilipinoFinnishFrenchFrench American IndianFrench CanadianGermanGerman RussianGhanaianGreekGuamanian/ChamorroGuatemalanGuyaneseHaitianHmongHonduranHopiHoumaHungarianIcelanderIndian (Asian)IndonesianInupiatIranianIraqiIrishIroquoisIsraeliItalianJamaicanJapaneseJordanianKenyanKiowaKoreanLaotianLatvianLebaneseLiberianLithuanianLumbeeLuxembourgerMacedonianMalaysianMalteseMarshalleseMenomineeMexicanMexican American IndianMongolianMoroccanNative HawaiianNavajoNepaleseNew ZealanderNicaraguanNigerianNorthern EuropeanNorwegianOkinawanOsageOttawaPaiutePakistaniPalestinianPanamanianParaguayanPennsylvania GermanPeruvianPimaPolishPortuguesePotawatomiPuebloPuerto RicanPuget Sound SalishRomanianRussianSalvadoranSamoanScandinavianScotch-IrishScottishSeminoleSenegaleseSerbianShoshoneSierra LeoneanSiouxSlavicSlovakSloveneSomaliSouth AfricanSouth AmericanSouth American IndianSoviet UnionSpaniardSpanishSpanish AmericanSpanish American IndianSri LankanSubsaharan AfricanSudaneseSwedishSwissSyrianTaiwaneseThaiTlingit-HaidaTohono O'OdhamTonganTrinidadian and TobagonianTsimshianTurkishU.S. Virgin IslanderUgandanUkrainianUruguayanUteVenezuelanVietnameseWelshWest IndianYakamaYaquiYugoslavianYumanYup'ikZimbabwean
Immigration
NonimmigrantsImmigrantsAfghanistanAfricaAlbaniaArgentinaArmeniaAsiaAustraliaAustriaBahamasBangladeshBarbadosBelarusBelgiumBelizeBoliviaBosnia and HerzegovinaBrazilBulgariaBurma/MyanmarCabo VerdeCambodiaCameroonCanadaCaribbeanCentral AmericaChileChinaColombiaCongoCosta RicaCroatiaCubaCzechoslovakiaDenmarkDominicaDominican RepublicEastern AfricaEastern AsiaEastern EuropeEcuadorEgyptEl SalvadorEnglandEritreaEthiopiaEuropeFijiFranceGermanyGhanaGreeceGrenadaGuatemalaGuyanaHaitiHondurasHong KongHungaryIndiaIndonesiaIranIraqIrelandIsraelItalyJamaicaJapanJordanKazakhstanKenyaKoreaKuwaitLaosLatin AmericaLatviaLebanonLiberiaLithuaniaMalaysiaMexicoMicronesiaMiddle AfricaMoldovaMoroccoNepalNetherlandsNicaraguaNigeriaNorth AmericaNorth MacedoniaNorthern AfricaNorthern EuropeNorwayOceaniaPakistanPanamaPeruPhilippinesPolandPortugalRomaniaRussiaSaudi ArabiaScotlandSenegalSerbiaSierra LeoneSingaporeSomaliaSouth AfricaSouth AmericaSouth Central AsiaSouth Eastern AsiaSouthern EuropeSpainSri LankaSt. Vincent and the GrenadinesSudanSwedenSwitzerlandSyriaTaiwanThailandTrinidad and TobagoTurkeyUgandaUkraineUruguayUzbekistanVenezuelaVietnamWest IndiesWestern AsiaWestern EuropeYemenZaireZimbabweAzores
No Vehicles in Household
Income
Poverty
Unemployment
Labor Participation
Family Structure
Vehicle Availability
Education Level
Disability

No Vehicles in Household Comparison

Immigrants from Western Africa

Immigrants from Italy

Tragic
Poor
15.0%
NO VEHICLES IN HOUSEHOLD
0.0/ 100
METRIC RATING
303rd/ 347
METRIC RANK
11.0%
NO VEHICLES IN HOUSEHOLD
15.6/ 100
METRIC RATING
208th/ 347
METRIC RANK

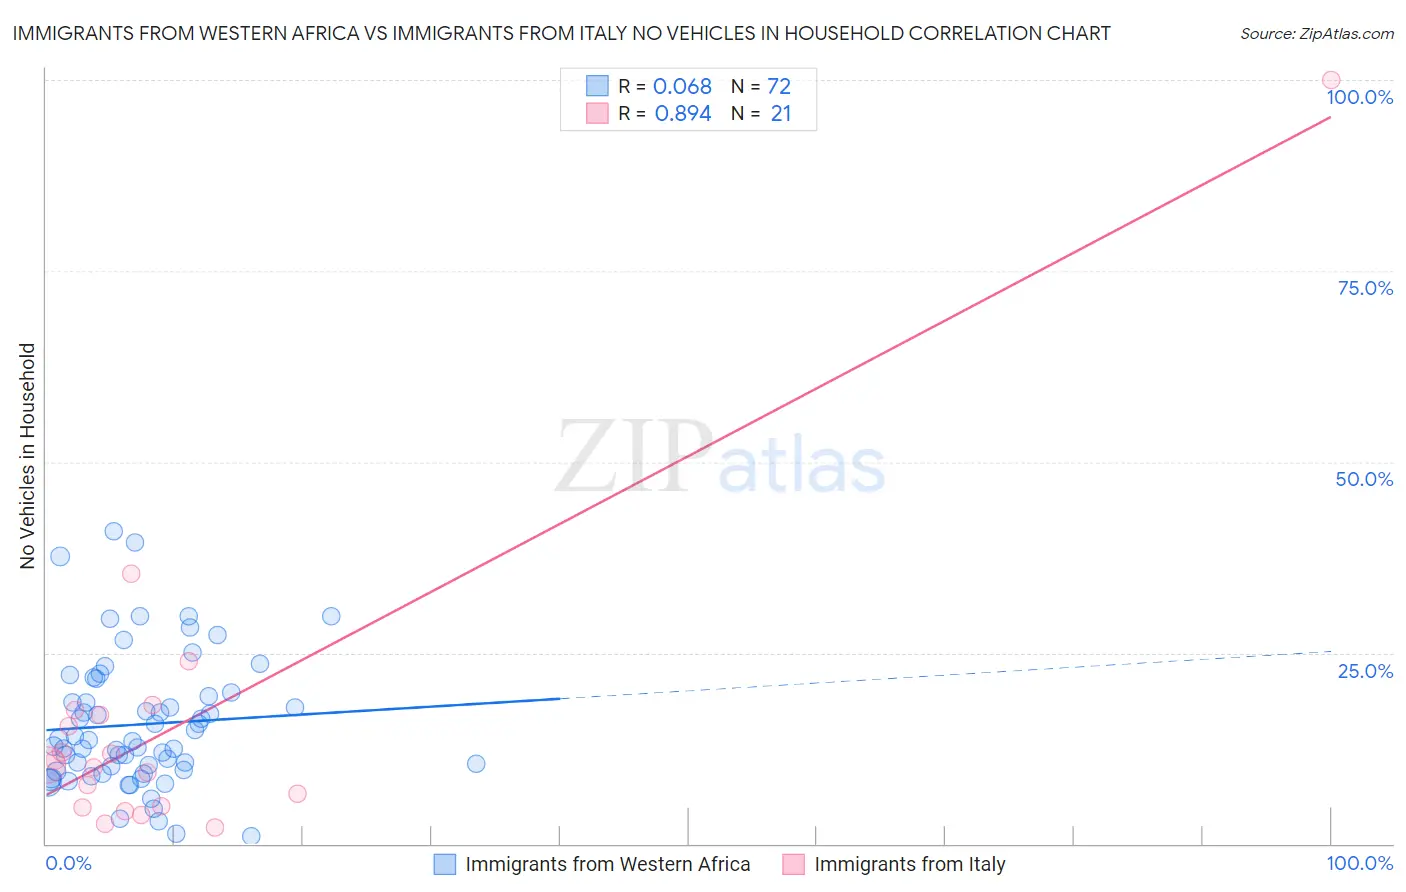
Immigrants from Western Africa vs Immigrants from Italy No Vehicles in Household Correlation Chart

The statistical analysis conducted on geographies consisting of 356,981,252 people shows a slight positive correlation between the proportion of Immigrants from Western Africa and percentage of households with no vehicle available in the United States with a correlation coefficient (R) of 0.068 and weighted average of 15.0%. Similarly, the statistical analysis conducted on geographies consisting of 323,696,139 people shows a very strong positive correlation between the proportion of Immigrants from Italy and percentage of households with no vehicle available in the United States with a correlation coefficient (R) of 0.894 and weighted average of 11.0%, a difference of 36.4%.
Immigrants from Western Africa vs Immigrants from Italy No Vehicles in Household

No Vehicles in Household Correlation Summary

MeasurementImmigrants from Western AfricaImmigrants from Italy
Minimum1.0%2.1%
Maximum40.9%100.0%
Range39.9%97.9%
Mean15.6%15.6%
Median13.5%10.4%
Interquartile 25% (IQ1)9.6%4.8%
Interquartile 75% (IQ3)19.6%17.2%
Interquartile Range (IQR)10.0%12.3%
Standard Deviation (Sample)8.6%20.9%
Standard Deviation (Population)8.5%20.4%

Similar Demographics by No Vehicles in Household

Demographics Similar to Immigrants from Western Africa by No Vehicles in Household

In terms of no vehicles in household, the demographic groups most similar to Immigrants from Western Africa are Haitian (14.9%, a difference of 0.52%), Immigrants from Russia (15.1%, a difference of 0.66%), Immigrants from Ukraine (14.9%, a difference of 0.99%), Yuman (14.9%, a difference of 1.0%), and Immigrants from China (15.2%, a difference of 1.0%).
DemographicsRating | RankNo Vehicles in Household
Immigrants | Spain
0.0
/100
|
#296
Tragic
14.5%
Immigrants | Panama
0.0
/100
|
#297
Tragic
14.6%
Moroccans
0.0
/100
|
#298
Tragic
14.7%
Immigrants | Greece
0.0
/100
|
#299
Tragic
14.7%
Yuman
0.0
/100
|
#300
Tragic
14.9%
Immigrants | Ukraine
0.0
/100
|
#301
Tragic
14.9%
Haitians
0.0
/100
|
#302
Tragic
14.9%
Immigrants | Western Africa
0.0
/100
|
#303
Tragic
15.0%
Immigrants | Russia
0.0
/100
|
#304
Tragic
15.1%
Immigrants | China
0.0
/100
|
#305
Tragic
15.2%
Immigrants | Belize
0.0
/100
|
#306
Tragic
15.4%
Immigrants | Haiti
0.0
/100
|
#307
Tragic
15.4%
U.S. Virgin Islanders
0.0
/100
|
#308
Tragic
15.4%
Puerto Ricans
0.0
/100
|
#309
Tragic
15.5%
Cape Verdeans
0.0
/100
|
#310
Tragic
15.6%

Demographics Similar to Immigrants from Italy by No Vehicles in Household

In terms of no vehicles in household, the demographic groups most similar to Immigrants from Italy are Sierra Leonean (11.0%, a difference of 0.010%), Pennsylvania German (11.0%, a difference of 0.030%), Somali (11.0%, a difference of 0.060%), Immigrants from Chile (11.0%, a difference of 0.070%), and Guatemalan (11.0%, a difference of 0.11%).
DemographicsRating | RankNo Vehicles in Household
Immigrants | Western Europe
19.1
/100
|
#201
Poor
10.9%
Romanians
17.9
/100
|
#202
Poor
10.9%
Iroquois
17.6
/100
|
#203
Poor
10.9%
Guatemalans
16.1
/100
|
#204
Poor
11.0%
Immigrants | Chile
15.9
/100
|
#205
Poor
11.0%
Somalis
15.9
/100
|
#206
Poor
11.0%
Sierra Leoneans
15.7
/100
|
#207
Poor
11.0%
Immigrants | Italy
15.6
/100
|
#208
Poor
11.0%
Pennsylvania Germans
15.5
/100
|
#209
Poor
11.0%
Apache
14.8
/100
|
#210
Poor
11.0%
Crow
14.2
/100
|
#211
Poor
11.0%
Immigrants | Western Asia
13.9
/100
|
#212
Poor
11.0%
Immigrants | Hungary
12.3
/100
|
#213
Poor
11.1%
Immigrants | Denmark
12.1
/100
|
#214
Poor
11.1%
Immigrants | Sri Lanka
10.6
/100
|
#215
Poor
11.2%