Immigrants from Western Africa vs Belizean 2 or more Vehicles in Household
COMPARE
Immigrants from Western Africa
Belizean
2 or more Vehicles in Household
2 or more Vehicles in Household Comparison
Immigrants from Western Africa
Belizeans
49.4%
2 OR MORE VEHICLES IN HOUSEHOLD
0.0/ 100
METRIC RATING
305th/ 347
METRIC RANK
51.0%
2 OR MORE VEHICLES IN HOUSEHOLD
0.0/ 100
METRIC RATING
291st/ 347
METRIC RANK
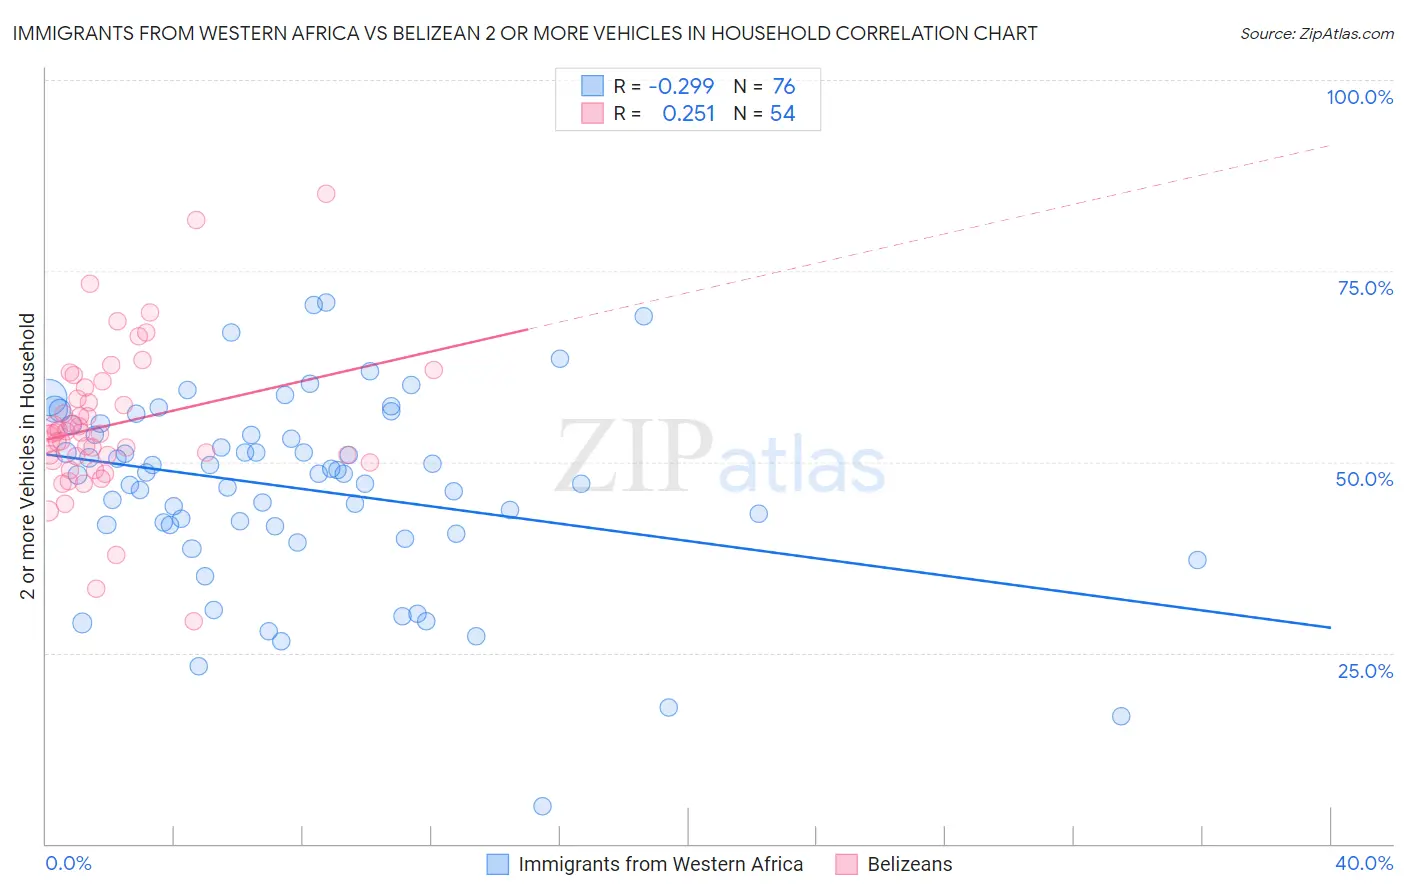
Immigrants from Western Africa vs Belizean 2 or more Vehicles in Household Correlation Chart
The statistical analysis conducted on geographies consisting of 357,581,747 people shows a weak negative correlation between the proportion of Immigrants from Western Africa and percentage of households with 2 or more vehicles available in the United States with a correlation coefficient (R) of -0.299 and weighted average of 49.4%. Similarly, the statistical analysis conducted on geographies consisting of 144,162,212 people shows a weak positive correlation between the proportion of Belizeans and percentage of households with 2 or more vehicles available in the United States with a correlation coefficient (R) of 0.251 and weighted average of 51.0%, a difference of 3.4%.
2 or more Vehicles in Household Correlation Summary
| Measurement | Immigrants from Western Africa | Belizean |
| Minimum | 4.9% | 29.2% |
| Maximum | 70.9% | 85.1% |
| Range | 66.0% | 55.9% |
| Mean | 46.5% | 54.9% |
| Median | 48.5% | 53.8% |
| Interquartile 25% (IQ1) | 41.6% | 50.2% |
| Interquartile 75% (IQ3) | 54.2% | 59.7% |
| Interquartile Range (IQR) | 12.6% | 9.5% |
| Standard Deviation (Sample) | 12.5% | 9.9% |
| Standard Deviation (Population) | 12.4% | 9.8% |
Demographics Similar to Immigrants from Western Africa and Belizeans by 2 or more Vehicles in Household
In terms of 2 or more vehicles in household, the demographic groups most similar to Immigrants from Western Africa are Immigrants from Israel (49.2%, a difference of 0.26%), Hopi (49.0%, a difference of 0.69%), Albanian (49.0%, a difference of 0.76%), Immigrants from Belize (49.9%, a difference of 1.1%), and Tohono O'odham (50.0%, a difference of 1.3%). Similarly, the demographic groups most similar to Belizeans are Immigrants from Panama (51.1%, a difference of 0.030%), Somali (51.1%, a difference of 0.10%), Immigrants from Ukraine (50.9%, a difference of 0.33%), Black/African American (50.9%, a difference of 0.33%), and Okinawan (51.2%, a difference of 0.38%).
| Demographics | Rating | Rank | 2 or more Vehicles in Household |
| Okinawans | 0.1 /100 | #288 | Tragic 51.2% |
| Somalis | 0.0 /100 | #289 | Tragic 51.1% |
| Immigrants | Panama | 0.0 /100 | #290 | Tragic 51.1% |
| Belizeans | 0.0 /100 | #291 | Tragic 51.0% |
| Immigrants | Ukraine | 0.0 /100 | #292 | Tragic 50.9% |
| Blacks/African Americans | 0.0 /100 | #293 | Tragic 50.9% |
| Bermudans | 0.0 /100 | #294 | Tragic 50.6% |
| Cypriots | 0.0 /100 | #295 | Tragic 50.6% |
| Immigrants | Somalia | 0.0 /100 | #296 | Tragic 50.5% |
| Immigrants | Spain | 0.0 /100 | #297 | Tragic 50.4% |
| Paraguayans | 0.0 /100 | #298 | Tragic 50.3% |
| Immigrants | Morocco | 0.0 /100 | #299 | Tragic 50.3% |
| Immigrants | Russia | 0.0 /100 | #300 | Tragic 50.3% |
| Immigrants | Greece | 0.0 /100 | #301 | Tragic 50.2% |
| Immigrants | South America | 0.0 /100 | #302 | Tragic 50.2% |
| Tohono O'odham | 0.0 /100 | #303 | Tragic 50.0% |
| Immigrants | Belize | 0.0 /100 | #304 | Tragic 49.9% |
| Immigrants | Western Africa | 0.0 /100 | #305 | Tragic 49.4% |
| Immigrants | Israel | 0.0 /100 | #306 | Tragic 49.2% |
| Hopi | 0.0 /100 | #307 | Tragic 49.0% |
| Albanians | 0.0 /100 | #308 | Tragic 49.0% |