Immigrants from Turkey vs Immigrants from South Africa No Vehicles in Household
COMPARE
Immigrants from Turkey
Immigrants from South Africa
No Vehicles in Household
No Vehicles in Household Comparison
Immigrants from Turkey
Immigrants from South Africa
11.5%
NO VEHICLES IN HOUSEHOLD
4.8/ 100
METRIC RATING
232nd/ 347
METRIC RANK
9.8%
NO VEHICLES IN HOUSEHOLD
85.0/ 100
METRIC RATING
136th/ 347
METRIC RANK
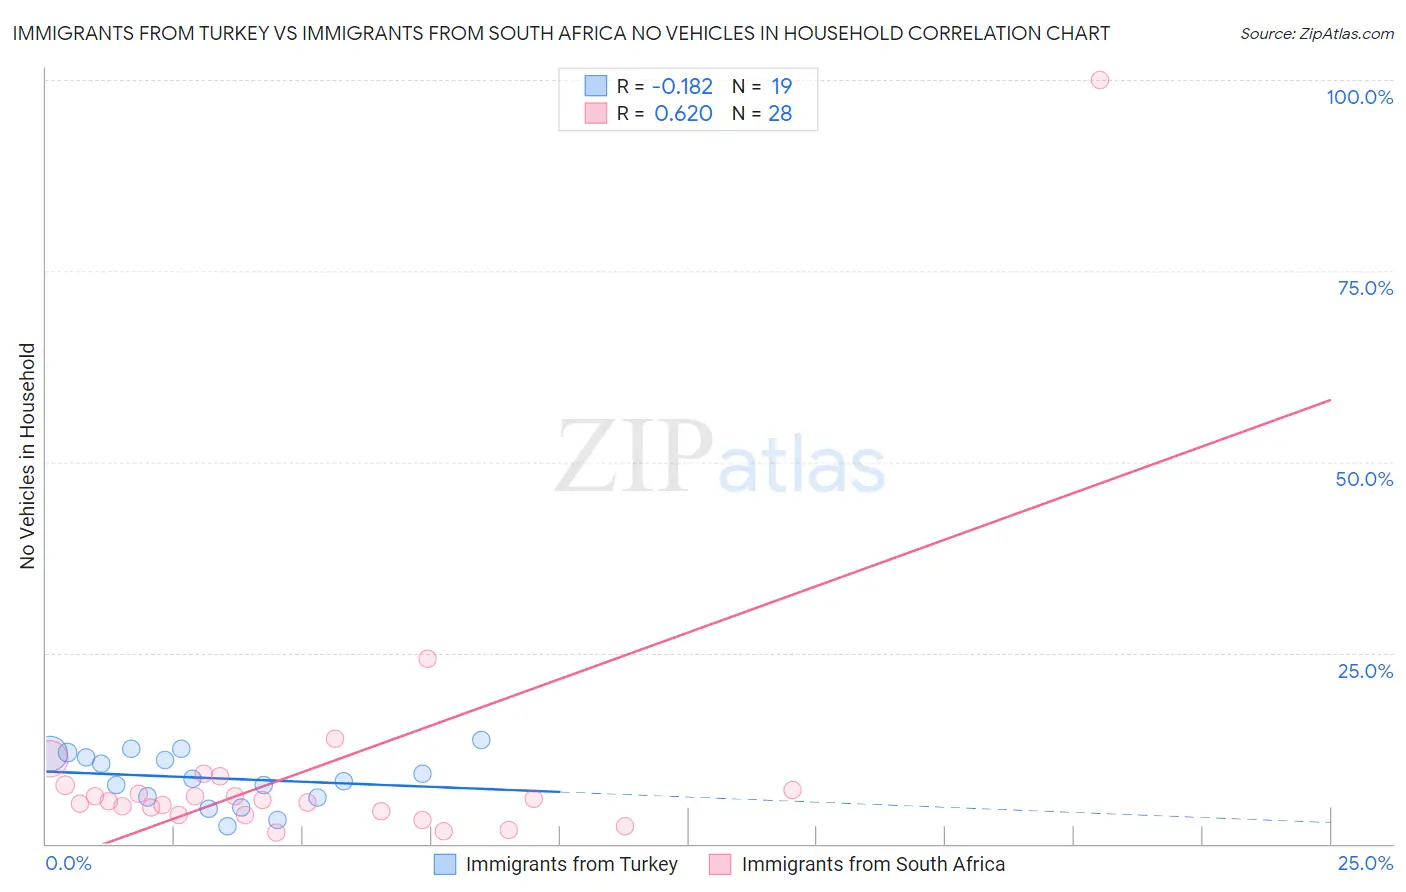
Immigrants from Turkey vs Immigrants from South Africa No Vehicles in Household Correlation Chart
The statistical analysis conducted on geographies consisting of 222,854,300 people shows a poor negative correlation between the proportion of Immigrants from Turkey and percentage of households with no vehicle available in the United States with a correlation coefficient (R) of -0.182 and weighted average of 11.5%. Similarly, the statistical analysis conducted on geographies consisting of 232,945,081 people shows a significant positive correlation between the proportion of Immigrants from South Africa and percentage of households with no vehicle available in the United States with a correlation coefficient (R) of 0.620 and weighted average of 9.8%, a difference of 17.0%.
No Vehicles in Household Correlation Summary
| Measurement | Immigrants from Turkey | Immigrants from South Africa |
| Minimum | 2.2% | 1.5% |
| Maximum | 13.5% | 100.0% |
| Range | 11.3% | 98.5% |
| Mean | 8.6% | 9.7% |
| Median | 8.5% | 5.7% |
| Interquartile 25% (IQ1) | 6.1% | 4.0% |
| Interquartile 75% (IQ3) | 11.7% | 7.3% |
| Interquartile Range (IQR) | 5.6% | 3.3% |
| Standard Deviation (Sample) | 3.4% | 18.2% |
| Standard Deviation (Population) | 3.3% | 17.9% |
Similar Demographics by No Vehicles in Household
Demographics Similar to Immigrants from Turkey by No Vehicles in Household
In terms of no vehicles in household, the demographic groups most similar to Immigrants from Turkey are Houma (11.5%, a difference of 0.040%), Immigrants from Norway (11.4%, a difference of 0.19%), Immigrants from Japan (11.4%, a difference of 0.19%), Immigrants from Peru (11.5%, a difference of 0.23%), and Ugandan (11.4%, a difference of 0.32%).
| Demographics | Rating | Rank | No Vehicles in Household |
| Immigrants | Sierra Leone | 6.4 /100 | #225 | Tragic 11.3% |
| Immigrants | Somalia | 5.4 /100 | #226 | Tragic 11.4% |
| Immigrants | Pakistan | 5.4 /100 | #227 | Tragic 11.4% |
| Immigrants | Romania | 5.3 /100 | #228 | Tragic 11.4% |
| Ugandans | 5.3 /100 | #229 | Tragic 11.4% |
| Immigrants | Norway | 5.1 /100 | #230 | Tragic 11.4% |
| Immigrants | Japan | 5.1 /100 | #231 | Tragic 11.4% |
| Immigrants | Turkey | 4.8 /100 | #232 | Tragic 11.5% |
| Houma | 4.7 /100 | #233 | Tragic 11.5% |
| Immigrants | Peru | 4.5 /100 | #234 | Tragic 11.5% |
| Kiowa | 4.0 /100 | #235 | Tragic 11.5% |
| Cree | 3.5 /100 | #236 | Tragic 11.6% |
| Ute | 3.3 /100 | #237 | Tragic 11.6% |
| Russians | 3.2 /100 | #238 | Tragic 11.6% |
| Taiwanese | 2.8 /100 | #239 | Tragic 11.7% |
Demographics Similar to Immigrants from South Africa by No Vehicles in Household
In terms of no vehicles in household, the demographic groups most similar to Immigrants from South Africa are Latvian (9.8%, a difference of 0.050%), Immigrants from Moldova (9.8%, a difference of 0.10%), Estonian (9.8%, a difference of 0.21%), Marshallese (9.8%, a difference of 0.26%), and Immigrants from Lithuania (9.8%, a difference of 0.27%).
| Demographics | Rating | Rank | No Vehicles in Household |
| Nicaraguans | 89.5 /100 | #129 | Excellent 9.7% |
| Burmese | 88.8 /100 | #130 | Excellent 9.7% |
| Immigrants | Azores | 88.2 /100 | #131 | Excellent 9.7% |
| Kenyans | 88.0 /100 | #132 | Excellent 9.7% |
| Immigrants | Oceania | 87.1 /100 | #133 | Excellent 9.7% |
| Syrians | 87.1 /100 | #134 | Excellent 9.7% |
| Latvians | 85.1 /100 | #135 | Excellent 9.8% |
| Immigrants | South Africa | 85.0 /100 | #136 | Excellent 9.8% |
| Immigrants | Moldova | 84.6 /100 | #137 | Excellent 9.8% |
| Estonians | 84.2 /100 | #138 | Excellent 9.8% |
| Marshallese | 84.0 /100 | #139 | Excellent 9.8% |
| Immigrants | Lithuania | 84.0 /100 | #140 | Excellent 9.8% |
| Sudanese | 83.1 /100 | #141 | Excellent 9.8% |
| Immigrants | Zimbabwe | 82.6 /100 | #142 | Excellent 9.9% |
| Chileans | 81.2 /100 | #143 | Excellent 9.9% |