Immigrants from Singapore vs Argentinean No Vehicles in Household
COMPARE
Immigrants from Singapore
Argentinean
No Vehicles in Household
No Vehicles in Household Comparison
Immigrants from Singapore
Argentineans
12.9%
NO VEHICLES IN HOUSEHOLD
0.1/ 100
METRIC RATING
274th/ 347
METRIC RANK
11.2%
NO VEHICLES IN HOUSEHOLD
9.6/ 100
METRIC RATING
219th/ 347
METRIC RANK
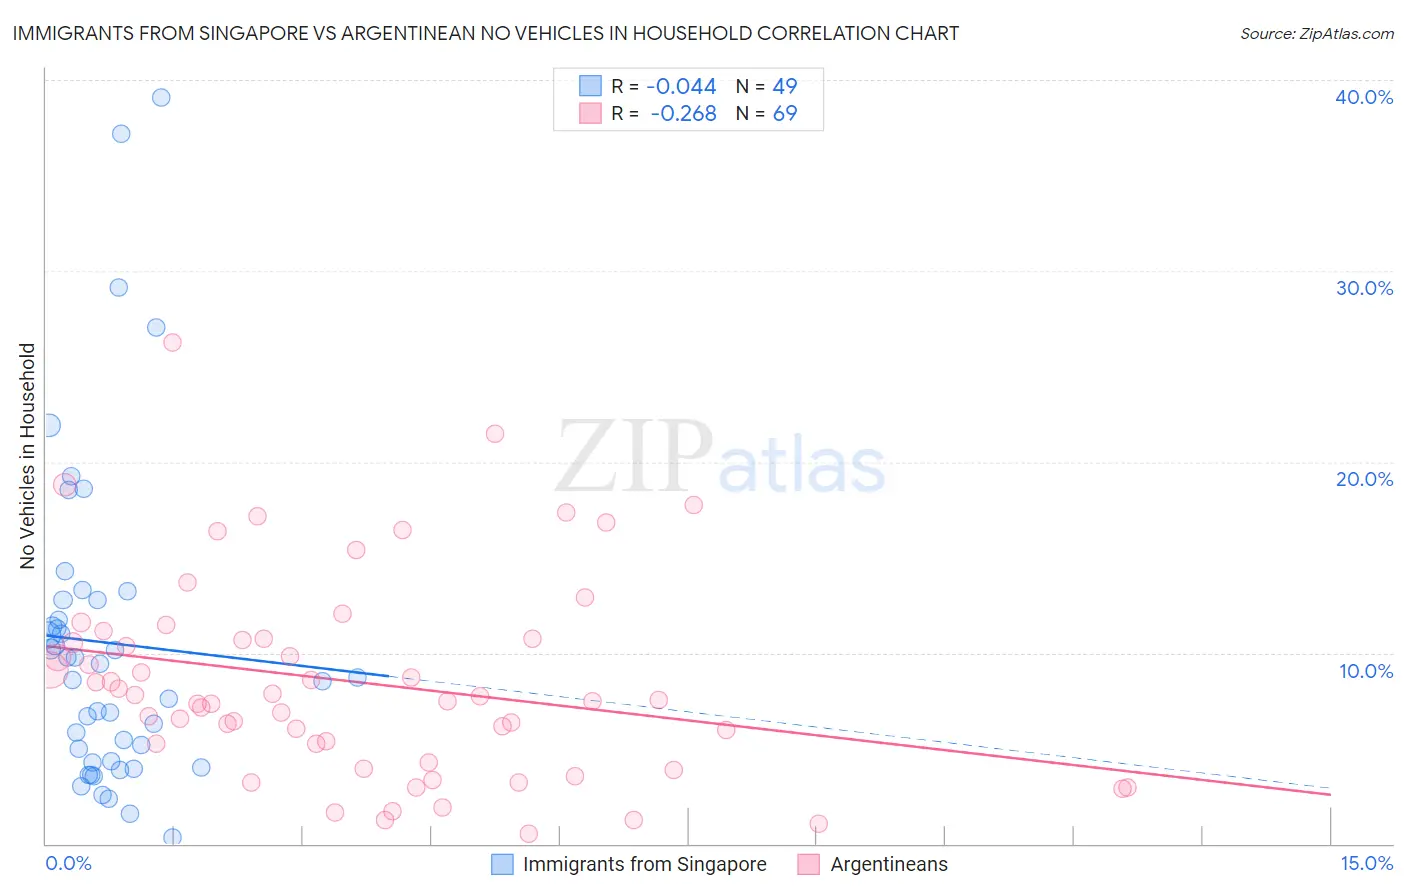
Immigrants from Singapore vs Argentinean No Vehicles in Household Correlation Chart
The statistical analysis conducted on geographies consisting of 137,399,438 people shows no correlation between the proportion of Immigrants from Singapore and percentage of households with no vehicle available in the United States with a correlation coefficient (R) of -0.044 and weighted average of 12.9%. Similarly, the statistical analysis conducted on geographies consisting of 296,712,761 people shows a weak negative correlation between the proportion of Argentineans and percentage of households with no vehicle available in the United States with a correlation coefficient (R) of -0.268 and weighted average of 11.2%, a difference of 15.7%.
No Vehicles in Household Correlation Summary
| Measurement | Immigrants from Singapore | Argentinean |
| Minimum | 0.35% | 0.52% |
| Maximum | 39.1% | 26.3% |
| Range | 38.7% | 25.7% |
| Mean | 10.5% | 8.5% |
| Median | 8.7% | 7.5% |
| Interquartile 25% (IQ1) | 4.3% | 4.7% |
| Interquartile 75% (IQ3) | 12.8% | 10.7% |
| Interquartile Range (IQR) | 8.5% | 6.0% |
| Standard Deviation (Sample) | 8.5% | 5.3% |
| Standard Deviation (Population) | 8.4% | 5.2% |
Similar Demographics by No Vehicles in Household
Demographics Similar to Immigrants from Singapore by No Vehicles in Household
In terms of no vehicles in household, the demographic groups most similar to Immigrants from Singapore are Immigrants from France (12.9%, a difference of 0.040%), Immigrants from Albania (13.0%, a difference of 0.18%), Immigrants from Southern Europe (13.0%, a difference of 0.54%), Aleut (13.0%, a difference of 0.62%), and Immigrants from Croatia (13.0%, a difference of 0.66%).
| Demographics | Rating | Rank | No Vehicles in Household |
| Immigrants | Europe | 0.3 /100 | #267 | Tragic 12.5% |
| Immigrants | Africa | 0.2 /100 | #268 | Tragic 12.5% |
| Panamanians | 0.2 /100 | #269 | Tragic 12.5% |
| Immigrants | Northern Africa | 0.2 /100 | #270 | Tragic 12.6% |
| Immigrants | Morocco | 0.2 /100 | #271 | Tragic 12.6% |
| Bermudans | 0.1 /100 | #272 | Tragic 12.8% |
| Immigrants | France | 0.1 /100 | #273 | Tragic 12.9% |
| Immigrants | Singapore | 0.1 /100 | #274 | Tragic 12.9% |
| Immigrants | Albania | 0.1 /100 | #275 | Tragic 13.0% |
| Immigrants | Southern Europe | 0.1 /100 | #276 | Tragic 13.0% |
| Aleuts | 0.1 /100 | #277 | Tragic 13.0% |
| Immigrants | Croatia | 0.1 /100 | #278 | Tragic 13.0% |
| Mongolians | 0.0 /100 | #279 | Tragic 13.1% |
| Alsatians | 0.0 /100 | #280 | Tragic 13.2% |
| Central American Indians | 0.0 /100 | #281 | Tragic 13.3% |
Demographics Similar to Argentineans by No Vehicles in Household
In terms of no vehicles in household, the demographic groups most similar to Argentineans are Immigrants from Zaire (11.2%, a difference of 0.010%), Immigrants from Guatemala (11.2%, a difference of 0.12%), Dutch West Indian (11.2%, a difference of 0.23%), Immigrants from Sri Lanka (11.2%, a difference of 0.35%), and Immigrants from Argentina (11.2%, a difference of 0.35%).
| Demographics | Rating | Rank | No Vehicles in Household |
| Immigrants | Western Asia | 13.9 /100 | #212 | Poor 11.0% |
| Immigrants | Hungary | 12.3 /100 | #213 | Poor 11.1% |
| Immigrants | Denmark | 12.1 /100 | #214 | Poor 11.1% |
| Immigrants | Sri Lanka | 10.6 /100 | #215 | Poor 11.2% |
| Immigrants | Argentina | 10.6 /100 | #216 | Poor 11.2% |
| Dutch West Indians | 10.2 /100 | #217 | Poor 11.2% |
| Immigrants | Guatemala | 10.0 /100 | #218 | Tragic 11.2% |
| Argentineans | 9.6 /100 | #219 | Tragic 11.2% |
| Immigrants | Zaire | 9.6 /100 | #220 | Tragic 11.2% |
| Peruvians | 8.4 /100 | #221 | Tragic 11.2% |
| Immigrants | South America | 8.0 /100 | #222 | Tragic 11.3% |
| Uruguayans | 7.7 /100 | #223 | Tragic 11.3% |
| Immigrants | Hong Kong | 7.2 /100 | #224 | Tragic 11.3% |
| Immigrants | Sierra Leone | 6.4 /100 | #225 | Tragic 11.3% |
| Immigrants | Somalia | 5.4 /100 | #226 | Tragic 11.4% |