Immigrants from Romania vs Immigrants from Western Asia No Vehicles in Household
COMPARE
Immigrants from Romania
Immigrants from Western Asia
No Vehicles in Household
No Vehicles in Household Comparison
Immigrants from Romania
Immigrants from Western Asia
11.4%
NO VEHICLES IN HOUSEHOLD
5.3/ 100
METRIC RATING
228th/ 347
METRIC RANK
11.0%
NO VEHICLES IN HOUSEHOLD
13.9/ 100
METRIC RATING
212th/ 347
METRIC RANK
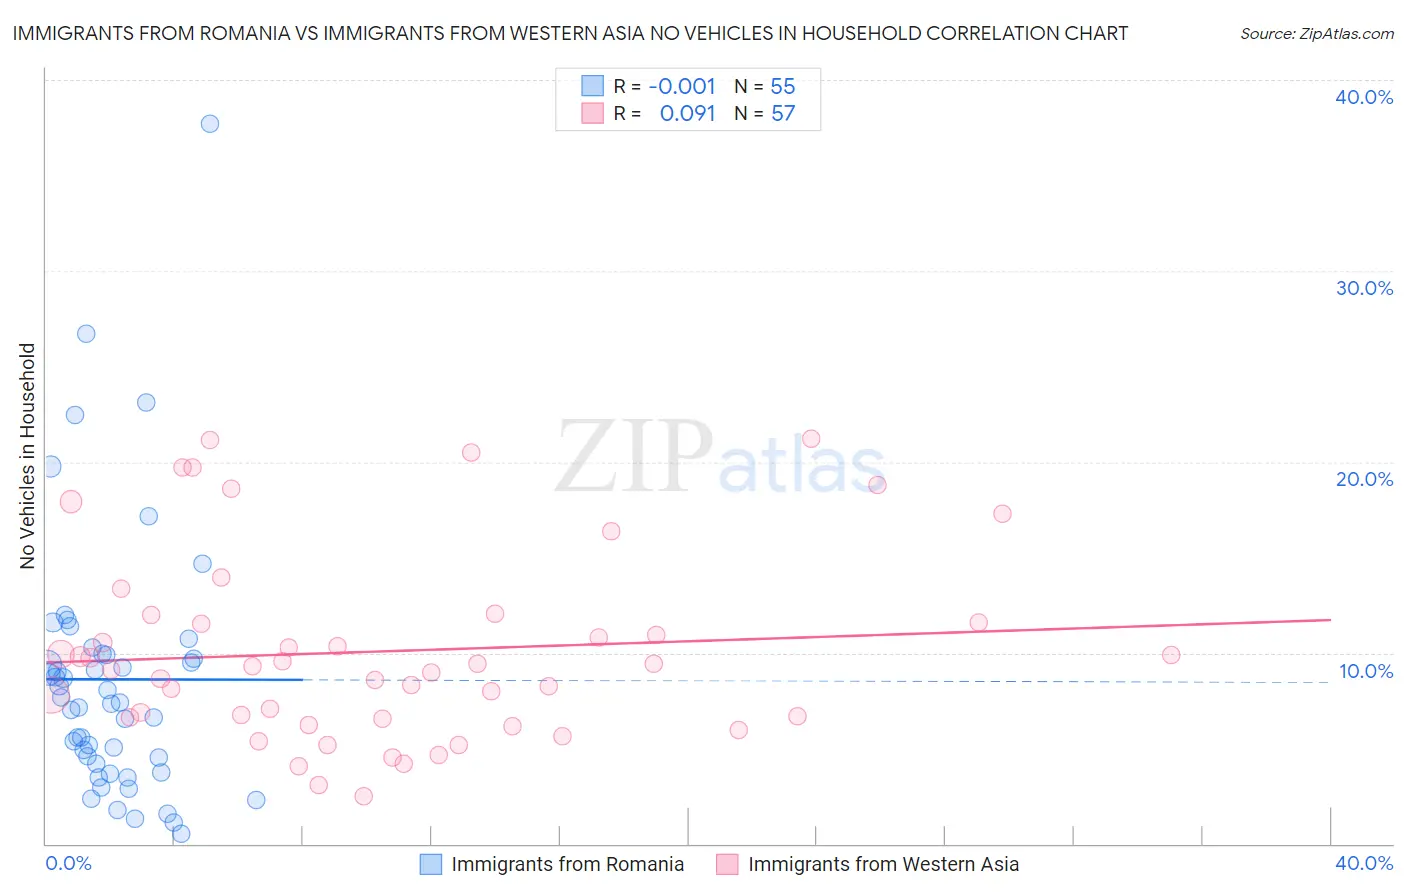
Immigrants from Romania vs Immigrants from Western Asia No Vehicles in Household Correlation Chart
The statistical analysis conducted on geographies consisting of 256,713,633 people shows no correlation between the proportion of Immigrants from Romania and percentage of households with no vehicle available in the United States with a correlation coefficient (R) of -0.001 and weighted average of 11.4%. Similarly, the statistical analysis conducted on geographies consisting of 403,545,957 people shows a slight positive correlation between the proportion of Immigrants from Western Asia and percentage of households with no vehicle available in the United States with a correlation coefficient (R) of 0.091 and weighted average of 11.0%, a difference of 3.4%.
No Vehicles in Household Correlation Summary
| Measurement | Immigrants from Romania | Immigrants from Western Asia |
| Minimum | 0.55% | 2.5% |
| Maximum | 37.7% | 21.2% |
| Range | 37.2% | 18.8% |
| Mean | 8.6% | 10.1% |
| Median | 7.4% | 9.3% |
| Interquartile 25% (IQ1) | 4.2% | 6.6% |
| Interquartile 75% (IQ3) | 9.9% | 11.8% |
| Interquartile Range (IQR) | 5.8% | 5.2% |
| Standard Deviation (Sample) | 6.8% | 4.9% |
| Standard Deviation (Population) | 6.8% | 4.9% |
Demographics Similar to Immigrants from Romania and Immigrants from Western Asia by No Vehicles in Household
In terms of no vehicles in household, the demographic groups most similar to Immigrants from Romania are Immigrants from Pakistan (11.4%, a difference of 0.040%), Ugandan (11.4%, a difference of 0.040%), Immigrants from Somalia (11.4%, a difference of 0.060%), Immigrants from Norway (11.4%, a difference of 0.16%), and Immigrants from Sierra Leone (11.3%, a difference of 0.62%). Similarly, the demographic groups most similar to Immigrants from Western Asia are Crow (11.0%, a difference of 0.090%), Apache (11.0%, a difference of 0.25%), Immigrants from Hungary (11.1%, a difference of 0.43%), Immigrants from Denmark (11.1%, a difference of 0.51%), and Immigrants from Sri Lanka (11.2%, a difference of 0.97%).
| Demographics | Rating | Rank | No Vehicles in Household |
| Apache | 14.8 /100 | #210 | Poor 11.0% |
| Crow | 14.2 /100 | #211 | Poor 11.0% |
| Immigrants | Western Asia | 13.9 /100 | #212 | Poor 11.0% |
| Immigrants | Hungary | 12.3 /100 | #213 | Poor 11.1% |
| Immigrants | Denmark | 12.1 /100 | #214 | Poor 11.1% |
| Immigrants | Sri Lanka | 10.6 /100 | #215 | Poor 11.2% |
| Immigrants | Argentina | 10.6 /100 | #216 | Poor 11.2% |
| Dutch West Indians | 10.2 /100 | #217 | Poor 11.2% |
| Immigrants | Guatemala | 10.0 /100 | #218 | Tragic 11.2% |
| Argentineans | 9.6 /100 | #219 | Tragic 11.2% |
| Immigrants | Zaire | 9.6 /100 | #220 | Tragic 11.2% |
| Peruvians | 8.4 /100 | #221 | Tragic 11.2% |
| Immigrants | South America | 8.0 /100 | #222 | Tragic 11.3% |
| Uruguayans | 7.7 /100 | #223 | Tragic 11.3% |
| Immigrants | Hong Kong | 7.2 /100 | #224 | Tragic 11.3% |
| Immigrants | Sierra Leone | 6.4 /100 | #225 | Tragic 11.3% |
| Immigrants | Somalia | 5.4 /100 | #226 | Tragic 11.4% |
| Immigrants | Pakistan | 5.4 /100 | #227 | Tragic 11.4% |
| Immigrants | Romania | 5.3 /100 | #228 | Tragic 11.4% |
| Ugandans | 5.3 /100 | #229 | Tragic 11.4% |
| Immigrants | Norway | 5.1 /100 | #230 | Tragic 11.4% |