Immigrants from Panama vs Immigrants from Oceania No Vehicles in Household

COMPARE

Immigrants from Panama
Race
Ancestry
AfghanAfricanAlaska NativeAlaskan AthabascanAlbanianAleutAlsatianAmericanApacheArabArapahoArgentineanArmenianAssyrian/Chaldean/SyriacAustralianAustrianBahamianBangladeshiBarbadianBasqueBelgianBelizeanBermudanBhutaneseBlackfeetBolivianBrazilianBritishBritish West IndianBulgarianBurmeseCajunCambodianCanadianCape VerdeanCarpatho RusynCelticCentral AmericanCentral American IndianCherokeeCheyenneChickasawChileanChineseChippewaChoctawColombianColvilleComancheCosta RicanCreeCreekCroatianCrowCubanCypriotCzechCzechoslovakianDanishDelawareDominicanDutchDutch West IndianEastern EuropeanEcuadorianEgyptianEnglishEstonianEthiopianEuropeanFijianFilipinoFinnishFrenchFrench American IndianFrench CanadianGermanGerman RussianGhanaianGreekGuamanian/ChamorroGuatemalanGuyaneseHaitianHmongHonduranHopiHoumaHungarianIcelanderIndian (Asian)IndonesianInupiatIranianIraqiIrishIroquoisIsraeliItalianJamaicanJapaneseJordanianKenyanKiowaKoreanLaotianLatvianLebaneseLiberianLithuanianLumbeeLuxembourgerMacedonianMalaysianMalteseMarshalleseMenomineeMexicanMexican American IndianMongolianMoroccanNative HawaiianNavajoNepaleseNew ZealanderNicaraguanNigerianNorthern EuropeanNorwegianOkinawanOsageOttawaPaiutePakistaniPalestinianPanamanianParaguayanPennsylvania GermanPeruvianPimaPolishPortuguesePotawatomiPuebloPuerto RicanPuget Sound SalishRomanianRussianSalvadoranSamoanScandinavianScotch-IrishScottishSeminoleSenegaleseSerbianShoshoneSierra LeoneanSiouxSlavicSlovakSloveneSomaliSouth AfricanSouth AmericanSouth American IndianSoviet UnionSpaniardSpanishSpanish AmericanSpanish American IndianSri LankanSubsaharan AfricanSudaneseSwedishSwissSyrianTaiwaneseThaiTlingit-HaidaTohono O'OdhamTonganTrinidadian and TobagonianTsimshianTurkishU.S. Virgin IslanderUgandanUkrainianUruguayanUteVenezuelanVietnameseWelshWest IndianYakamaYaquiYugoslavianYumanYup'ikZimbabwean
Immigration
NonimmigrantsImmigrantsAfghanistanAfricaAlbaniaArgentinaArmeniaAsiaAustraliaAustriaBahamasBangladeshBarbadosBelarusBelgiumBelizeBoliviaBosnia and HerzegovinaBrazilBulgariaBurma/MyanmarCabo VerdeCambodiaCameroonCanadaCaribbeanCentral AmericaChileChinaColombiaCongoCosta RicaCroatiaCubaCzechoslovakiaDenmarkDominicaDominican RepublicEastern AfricaEastern AsiaEastern EuropeEcuadorEgyptEl SalvadorEnglandEritreaEthiopiaEuropeFijiFranceGermanyGhanaGreeceGrenadaGuatemalaGuyanaHaitiHondurasHong KongHungaryIndiaIndonesiaIranIraqIrelandIsraelItalyJamaicaJapanJordanKazakhstanKenyaKoreaKuwaitLaosLatin AmericaLatviaLebanonLiberiaLithuaniaMalaysiaMexicoMicronesiaMiddle AfricaMoldovaMoroccoNepalNetherlandsNicaraguaNigeriaNorth AmericaNorth MacedoniaNorthern AfricaNorthern EuropeNorwayPakistanPanamaPeruPhilippinesPolandPortugalRomaniaRussiaSaudi ArabiaScotlandSenegalSerbiaSierra LeoneSingaporeSomaliaSouth AfricaSouth AmericaSouth Central AsiaSouth Eastern AsiaSouthern EuropeSpainSri LankaSt. Vincent and the GrenadinesSudanSwedenSwitzerlandSyriaTaiwanThailandTrinidad and TobagoTurkeyUgandaUkraineUruguayUzbekistanVenezuelaVietnamWest IndiesWestern AfricaWestern AsiaWestern EuropeYemenZaireZimbabweAzores
Immigrants from Oceania
Race
Ancestry
AfghanAfricanAlaska NativeAlaskan AthabascanAlbanianAleutAlsatianAmericanApacheArabArapahoArgentineanArmenianAssyrian/Chaldean/SyriacAustralianAustrianBahamianBangladeshiBarbadianBasqueBelgianBelizeanBermudanBhutaneseBlackfeetBolivianBrazilianBritishBritish West IndianBulgarianBurmeseCajunCambodianCanadianCape VerdeanCarpatho RusynCelticCentral AmericanCentral American IndianCherokeeCheyenneChickasawChileanChineseChippewaChoctawColombianColvilleComancheCosta RicanCreeCreekCroatianCrowCubanCypriotCzechCzechoslovakianDanishDelawareDominicanDutchDutch West IndianEastern EuropeanEcuadorianEgyptianEnglishEstonianEthiopianEuropeanFijianFilipinoFinnishFrenchFrench American IndianFrench CanadianGermanGerman RussianGhanaianGreekGuamanian/ChamorroGuatemalanGuyaneseHaitianHmongHonduranHopiHoumaHungarianIcelanderIndian (Asian)IndonesianInupiatIranianIraqiIrishIroquoisIsraeliItalianJamaicanJapaneseJordanianKenyanKiowaKoreanLaotianLatvianLebaneseLiberianLithuanianLumbeeLuxembourgerMacedonianMalaysianMalteseMarshalleseMenomineeMexicanMexican American IndianMongolianMoroccanNative HawaiianNavajoNepaleseNew ZealanderNicaraguanNigerianNorthern EuropeanNorwegianOkinawanOsageOttawaPaiutePakistaniPalestinianPanamanianParaguayanPennsylvania GermanPeruvianPimaPolishPortuguesePotawatomiPuebloPuerto RicanPuget Sound SalishRomanianRussianSalvadoranSamoanScandinavianScotch-IrishScottishSeminoleSenegaleseSerbianShoshoneSierra LeoneanSiouxSlavicSlovakSloveneSomaliSouth AfricanSouth AmericanSouth American IndianSoviet UnionSpaniardSpanishSpanish AmericanSpanish American IndianSri LankanSubsaharan AfricanSudaneseSwedishSwissSyrianTaiwaneseThaiTlingit-HaidaTohono O'OdhamTonganTrinidadian and TobagonianTsimshianTurkishU.S. Virgin IslanderUgandanUkrainianUruguayanUteVenezuelanVietnameseWelshWest IndianYakamaYaquiYugoslavianYumanYup'ikZimbabwean
Immigration
NonimmigrantsImmigrantsAfghanistanAfricaAlbaniaArgentinaArmeniaAsiaAustraliaAustriaBahamasBangladeshBarbadosBelarusBelgiumBelizeBoliviaBosnia and HerzegovinaBrazilBulgariaBurma/MyanmarCabo VerdeCambodiaCameroonCanadaCaribbeanCentral AmericaChileChinaColombiaCongoCosta RicaCroatiaCubaCzechoslovakiaDenmarkDominicaDominican RepublicEastern AfricaEastern AsiaEastern EuropeEcuadorEgyptEl SalvadorEnglandEritreaEthiopiaEuropeFijiFranceGermanyGhanaGreeceGrenadaGuatemalaGuyanaHaitiHondurasHong KongHungaryIndiaIndonesiaIranIraqIrelandIsraelItalyJamaicaJapanJordanKazakhstanKenyaKoreaKuwaitLaosLatin AmericaLatviaLebanonLiberiaLithuaniaMalaysiaMexicoMicronesiaMiddle AfricaMoldovaMoroccoNepalNetherlandsNicaraguaNigeriaNorth AmericaNorth MacedoniaNorthern AfricaNorthern EuropeNorwayOceaniaPakistanPeruPhilippinesPolandPortugalRomaniaRussiaSaudi ArabiaScotlandSenegalSerbiaSierra LeoneSingaporeSomaliaSouth AfricaSouth AmericaSouth Central AsiaSouth Eastern AsiaSouthern EuropeSpainSri LankaSt. Vincent and the GrenadinesSudanSwedenSwitzerlandSyriaTaiwanThailandTrinidad and TobagoTurkeyUgandaUkraineUruguayUzbekistanVenezuelaVietnamWest IndiesWestern AfricaWestern AsiaWestern EuropeYemenZaireZimbabweAzores
No Vehicles in Household
Income
Poverty
Unemployment
Labor Participation
Family Structure
Vehicle Availability
Education Level
Disability

No Vehicles in Household Comparison

Immigrants from Panama

Immigrants from Oceania

Tragic
Excellent
14.6%
NO VEHICLES IN HOUSEHOLD
0.0/ 100
METRIC RATING
297th/ 347
METRIC RANK
9.7%
NO VEHICLES IN HOUSEHOLD
87.1/ 100
METRIC RATING
133rd/ 347
METRIC RANK

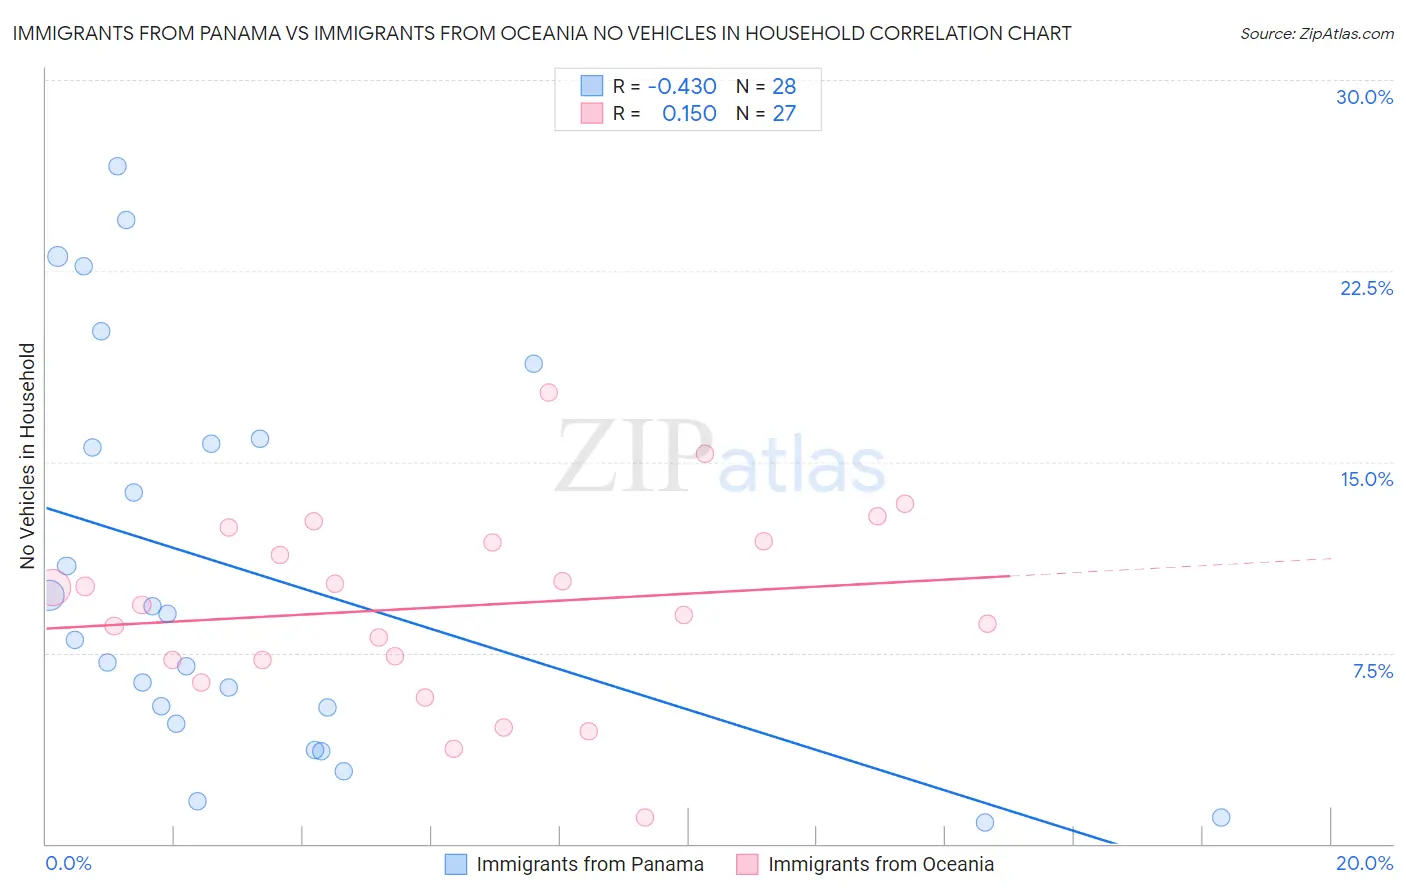
Immigrants from Panama vs Immigrants from Oceania No Vehicles in Household Correlation Chart

The statistical analysis conducted on geographies consisting of 221,041,162 people shows a moderate negative correlation between the proportion of Immigrants from Panama and percentage of households with no vehicle available in the United States with a correlation coefficient (R) of -0.430 and weighted average of 14.6%. Similarly, the statistical analysis conducted on geographies consisting of 304,786,769 people shows a poor positive correlation between the proportion of Immigrants from Oceania and percentage of households with no vehicle available in the United States with a correlation coefficient (R) of 0.150 and weighted average of 9.7%, a difference of 50.5%.
Immigrants from Panama vs Immigrants from Oceania No Vehicles in Household

No Vehicles in Household Correlation Summary

MeasurementImmigrants from PanamaImmigrants from Oceania
Minimum0.82%1.0%
Maximum26.6%17.7%
Range25.8%16.7%
Mean10.7%9.3%
Median8.5%9.4%
Interquartile 25% (IQ1)5.0%7.2%
Interquartile 75% (IQ3)15.8%11.9%
Interquartile Range (IQR)10.8%4.7%
Standard Deviation (Sample)7.7%3.7%
Standard Deviation (Population)7.5%3.6%

Similar Demographics by No Vehicles in Household

Demographics Similar to Immigrants from Panama by No Vehicles in Household

In terms of no vehicles in household, the demographic groups most similar to Immigrants from Panama are Moroccan (14.7%, a difference of 0.15%), Immigrants from Greece (14.7%, a difference of 0.35%), Immigrants from Spain (14.5%, a difference of 0.67%), Yuman (14.9%, a difference of 1.4%), and Immigrants from Ukraine (14.9%, a difference of 1.4%).
DemographicsRating | RankNo Vehicles in Household
Indians (Asian)
0.0
/100
|
#290
Tragic
14.1%
Okinawans
0.0
/100
|
#291
Tragic
14.1%
Pima
0.0
/100
|
#292
Tragic
14.1%
Immigrants | Jamaica
0.0
/100
|
#293
Tragic
14.2%
Belizeans
0.0
/100
|
#294
Tragic
14.3%
Paraguayans
0.0
/100
|
#295
Tragic
14.4%
Immigrants | Spain
0.0
/100
|
#296
Tragic
14.5%
Immigrants | Panama
0.0
/100
|
#297
Tragic
14.6%
Moroccans
0.0
/100
|
#298
Tragic
14.7%
Immigrants | Greece
0.0
/100
|
#299
Tragic
14.7%
Yuman
0.0
/100
|
#300
Tragic
14.9%
Immigrants | Ukraine
0.0
/100
|
#301
Tragic
14.9%
Haitians
0.0
/100
|
#302
Tragic
14.9%
Immigrants | Western Africa
0.0
/100
|
#303
Tragic
15.0%
Immigrants | Russia
0.0
/100
|
#304
Tragic
15.1%

Demographics Similar to Immigrants from Oceania by No Vehicles in Household

In terms of no vehicles in household, the demographic groups most similar to Immigrants from Oceania are Syrian (9.7%, a difference of 0.020%), Kenyan (9.7%, a difference of 0.30%), Immigrants from the Azores (9.7%, a difference of 0.37%), Burmese (9.7%, a difference of 0.58%), and Latvian (9.8%, a difference of 0.60%).
DemographicsRating | RankNo Vehicles in Household
Icelanders
90.2
/100
|
#126
Exceptional
9.6%
Immigrants | Kenya
89.7
/100
|
#127
Excellent
9.6%
Immigrants | Syria
89.5
/100
|
#128
Excellent
9.6%
Nicaraguans
89.5
/100
|
#129
Excellent
9.7%
Burmese
88.8
/100
|
#130
Excellent
9.7%
Immigrants | Azores
88.2
/100
|
#131
Excellent
9.7%
Kenyans
88.0
/100
|
#132
Excellent
9.7%
Immigrants | Oceania
87.1
/100
|
#133
Excellent
9.7%
Syrians
87.1
/100
|
#134
Excellent
9.7%
Latvians
85.1
/100
|
#135
Excellent
9.8%
Immigrants | South Africa
85.0
/100
|
#136
Excellent
9.8%
Immigrants | Moldova
84.6
/100
|
#137
Excellent
9.8%
Estonians
84.2
/100
|
#138
Excellent
9.8%
Marshallese
84.0
/100
|
#139
Excellent
9.8%
Immigrants | Lithuania
84.0
/100
|
#140
Excellent
9.8%