Immigrants from Oceania vs Arab No Vehicles in Household
COMPARE
Immigrants from Oceania
Arab
No Vehicles in Household
No Vehicles in Household Comparison
Immigrants from Oceania
Arabs
9.7%
NO VEHICLES IN HOUSEHOLD
87.1/ 100
METRIC RATING
133rd/ 347
METRIC RANK
10.5%
NO VEHICLES IN HOUSEHOLD
45.3/ 100
METRIC RATING
180th/ 347
METRIC RANK
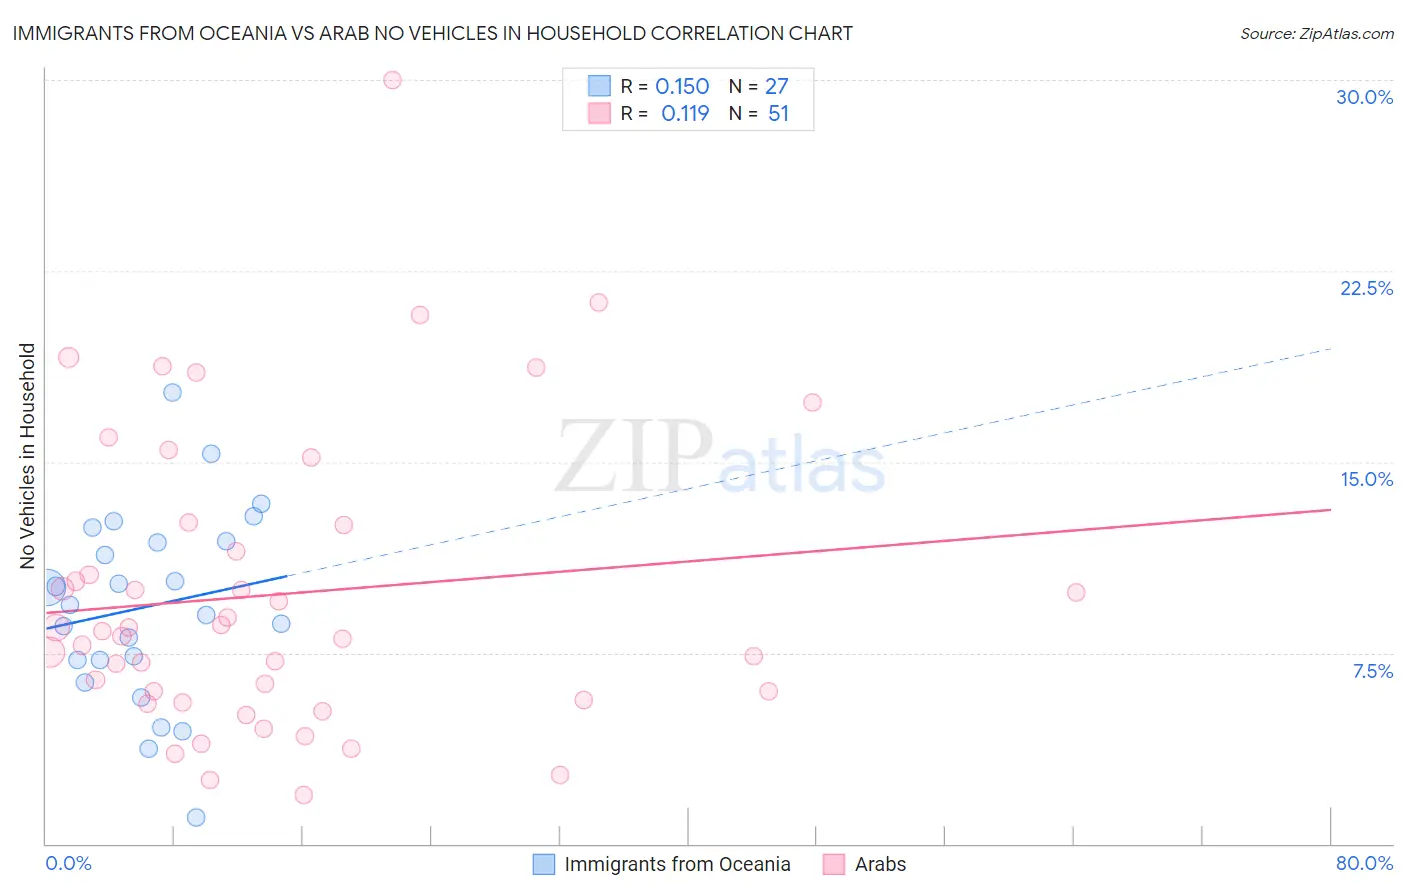
Immigrants from Oceania vs Arab No Vehicles in Household Correlation Chart
The statistical analysis conducted on geographies consisting of 304,786,769 people shows a poor positive correlation between the proportion of Immigrants from Oceania and percentage of households with no vehicle available in the United States with a correlation coefficient (R) of 0.150 and weighted average of 9.7%. Similarly, the statistical analysis conducted on geographies consisting of 484,728,564 people shows a poor positive correlation between the proportion of Arabs and percentage of households with no vehicle available in the United States with a correlation coefficient (R) of 0.119 and weighted average of 10.5%, a difference of 7.6%.
No Vehicles in Household Correlation Summary
| Measurement | Immigrants from Oceania | Arab |
| Minimum | 1.0% | 1.9% |
| Maximum | 17.7% | 30.0% |
| Range | 16.7% | 28.1% |
| Mean | 9.3% | 9.8% |
| Median | 9.4% | 8.4% |
| Interquartile 25% (IQ1) | 7.2% | 5.6% |
| Interquartile 75% (IQ3) | 11.9% | 12.5% |
| Interquartile Range (IQR) | 4.7% | 6.9% |
| Standard Deviation (Sample) | 3.7% | 5.8% |
| Standard Deviation (Population) | 3.6% | 5.8% |
Similar Demographics by No Vehicles in Household
Demographics Similar to Immigrants from Oceania by No Vehicles in Household
In terms of no vehicles in household, the demographic groups most similar to Immigrants from Oceania are Syrian (9.7%, a difference of 0.020%), Kenyan (9.7%, a difference of 0.30%), Immigrants from the Azores (9.7%, a difference of 0.37%), Burmese (9.7%, a difference of 0.58%), and Latvian (9.8%, a difference of 0.60%).
| Demographics | Rating | Rank | No Vehicles in Household |
| Icelanders | 90.2 /100 | #126 | Exceptional 9.6% |
| Immigrants | Kenya | 89.7 /100 | #127 | Excellent 9.6% |
| Immigrants | Syria | 89.5 /100 | #128 | Excellent 9.6% |
| Nicaraguans | 89.5 /100 | #129 | Excellent 9.7% |
| Burmese | 88.8 /100 | #130 | Excellent 9.7% |
| Immigrants | Azores | 88.2 /100 | #131 | Excellent 9.7% |
| Kenyans | 88.0 /100 | #132 | Excellent 9.7% |
| Immigrants | Oceania | 87.1 /100 | #133 | Excellent 9.7% |
| Syrians | 87.1 /100 | #134 | Excellent 9.7% |
| Latvians | 85.1 /100 | #135 | Excellent 9.8% |
| Immigrants | South Africa | 85.0 /100 | #136 | Excellent 9.8% |
| Immigrants | Moldova | 84.6 /100 | #137 | Excellent 9.8% |
| Estonians | 84.2 /100 | #138 | Excellent 9.8% |
| Marshallese | 84.0 /100 | #139 | Excellent 9.8% |
| Immigrants | Lithuania | 84.0 /100 | #140 | Excellent 9.8% |
Demographics Similar to Arabs by No Vehicles in Household
In terms of no vehicles in household, the demographic groups most similar to Arabs are Ethiopian (10.5%, a difference of 0.060%), Immigrants from Colombia (10.5%, a difference of 0.16%), Immigrants from Bulgaria (10.5%, a difference of 0.20%), Native/Alaskan (10.5%, a difference of 0.22%), and Immigrants from Ethiopia (10.4%, a difference of 0.36%).
| Demographics | Rating | Rank | No Vehicles in Household |
| Filipinos | 50.1 /100 | #173 | Average 10.4% |
| Immigrants | Sudan | 50.0 /100 | #174 | Average 10.4% |
| Immigrants | Burma/Myanmar | 49.1 /100 | #175 | Average 10.4% |
| French American Indians | 49.1 /100 | #176 | Average 10.4% |
| Immigrants | El Salvador | 49.1 /100 | #177 | Average 10.4% |
| Immigrants | Ethiopia | 48.0 /100 | #178 | Average 10.4% |
| Ethiopians | 45.8 /100 | #179 | Average 10.5% |
| Arabs | 45.3 /100 | #180 | Average 10.5% |
| Immigrants | Colombia | 44.1 /100 | #181 | Average 10.5% |
| Immigrants | Bulgaria | 43.8 /100 | #182 | Average 10.5% |
| Natives/Alaskans | 43.7 /100 | #183 | Average 10.5% |
| Immigrants | Nepal | 42.4 /100 | #184 | Average 10.5% |
| South Americans | 41.9 /100 | #185 | Average 10.5% |
| German Russians | 40.6 /100 | #186 | Average 10.5% |
| Immigrants | Poland | 38.4 /100 | #187 | Fair 10.6% |