Immigrants from Northern Europe vs Nepalese 2 or more Vehicles in Household
COMPARE
Immigrants from Northern Europe
Nepalese
2 or more Vehicles in Household
2 or more Vehicles in Household Comparison
Immigrants from Northern Europe
Nepalese
56.1%
2 OR MORE VEHICLES IN HOUSEHOLD
78.7/ 100
METRIC RATING
151st/ 347
METRIC RANK
61.4%
2 OR MORE VEHICLES IN HOUSEHOLD
100.0/ 100
METRIC RATING
15th/ 347
METRIC RANK
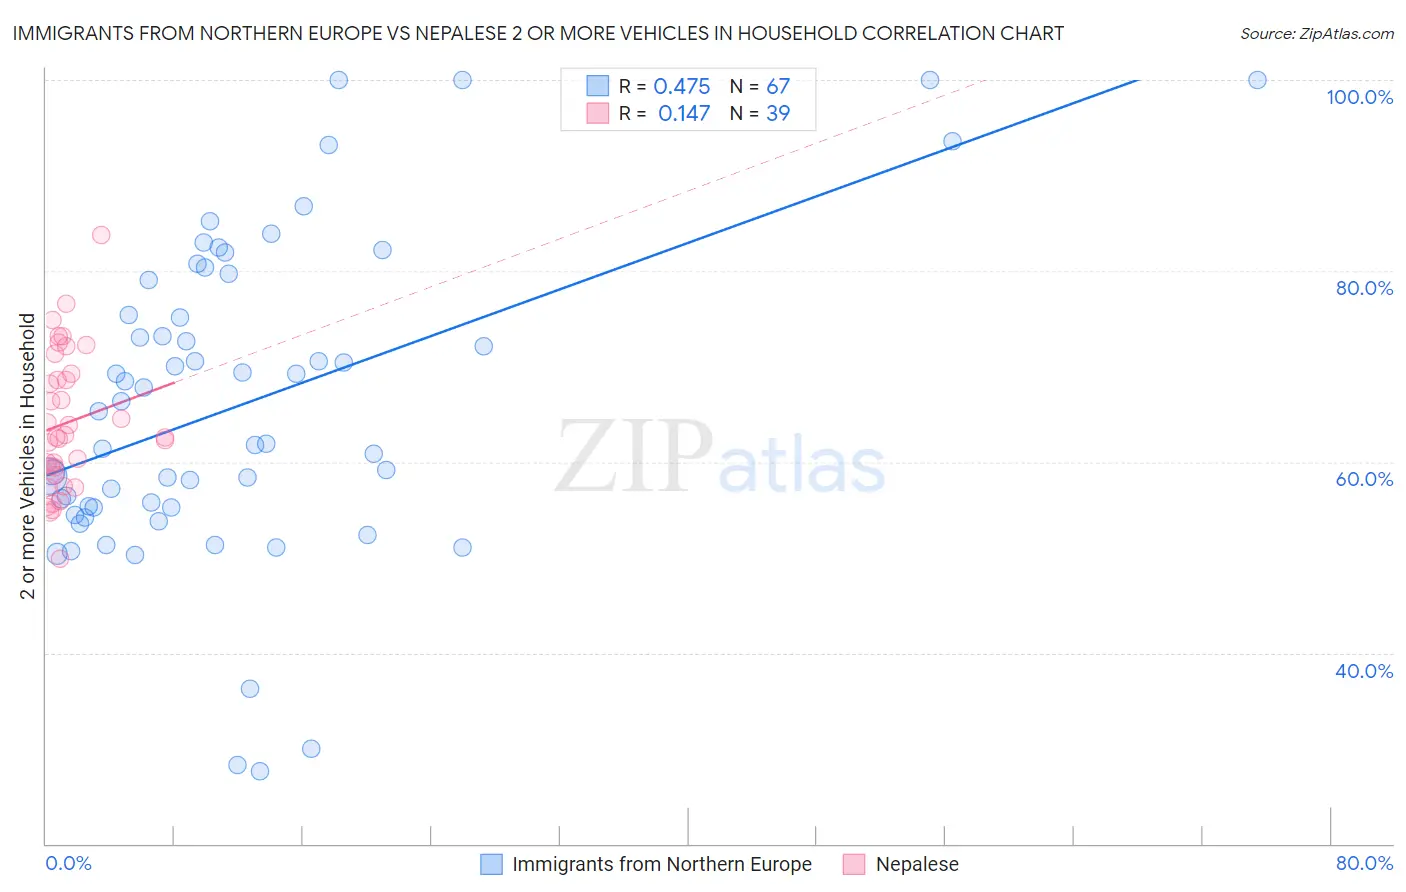
Immigrants from Northern Europe vs Nepalese 2 or more Vehicles in Household Correlation Chart
The statistical analysis conducted on geographies consisting of 476,975,889 people shows a moderate positive correlation between the proportion of Immigrants from Northern Europe and percentage of households with 2 or more vehicles available in the United States with a correlation coefficient (R) of 0.475 and weighted average of 56.1%. Similarly, the statistical analysis conducted on geographies consisting of 24,483,296 people shows a poor positive correlation between the proportion of Nepalese and percentage of households with 2 or more vehicles available in the United States with a correlation coefficient (R) of 0.147 and weighted average of 61.4%, a difference of 9.5%.
2 or more Vehicles in Household Correlation Summary
| Measurement | Immigrants from Northern Europe | Nepalese |
| Minimum | 27.6% | 49.8% |
| Maximum | 100.0% | 83.8% |
| Range | 72.4% | 33.9% |
| Mean | 66.1% | 64.1% |
| Median | 65.3% | 62.5% |
| Interquartile 25% (IQ1) | 55.2% | 58.6% |
| Interquartile 75% (IQ3) | 79.1% | 69.3% |
| Interquartile Range (IQR) | 23.9% | 10.7% |
| Standard Deviation (Sample) | 16.6% | 7.3% |
| Standard Deviation (Population) | 16.5% | 7.2% |
Similar Demographics by 2 or more Vehicles in Household
Demographics Similar to Immigrants from Northern Europe by 2 or more Vehicles in Household
In terms of 2 or more vehicles in household, the demographic groups most similar to Immigrants from Northern Europe are Immigrants from Pakistan (56.1%, a difference of 0.030%), Nicaraguan (56.1%, a difference of 0.070%), Immigrants from Moldova (56.1%, a difference of 0.090%), Chilean (56.1%, a difference of 0.090%), and Serbian (56.1%, a difference of 0.10%).
| Demographics | Rating | Rank | 2 or more Vehicles in Household |
| Immigrants | Syria | 81.4 /100 | #144 | Excellent 56.2% |
| Syrians | 81.2 /100 | #145 | Excellent 56.2% |
| Venezuelans | 80.7 /100 | #146 | Excellent 56.1% |
| Serbians | 80.3 /100 | #147 | Excellent 56.1% |
| Immigrants | Moldova | 80.2 /100 | #148 | Excellent 56.1% |
| Chileans | 80.2 /100 | #149 | Excellent 56.1% |
| Nicaraguans | 79.9 /100 | #150 | Good 56.1% |
| Immigrants | Northern Europe | 78.7 /100 | #151 | Good 56.1% |
| Immigrants | Pakistan | 78.1 /100 | #152 | Good 56.1% |
| Lumbee | 71.9 /100 | #153 | Good 55.9% |
| Ukrainians | 70.8 /100 | #154 | Good 55.8% |
| Immigrants | Venezuela | 70.7 /100 | #155 | Good 55.8% |
| Immigrants | Lithuania | 70.4 /100 | #156 | Good 55.8% |
| Immigrants | Kuwait | 70.2 /100 | #157 | Good 55.8% |
| Tlingit-Haida | 68.5 /100 | #158 | Good 55.8% |
Demographics Similar to Nepalese by 2 or more Vehicles in Household
In terms of 2 or more vehicles in household, the demographic groups most similar to Nepalese are Native Hawaiian (61.4%, a difference of 0.020%), Czech (61.5%, a difference of 0.090%), Basque (61.4%, a difference of 0.090%), European (61.4%, a difference of 0.10%), and Samoan (61.5%, a difference of 0.14%).
| Demographics | Rating | Rank | 2 or more Vehicles in Household |
| English | 100.0 /100 | #8 | Exceptional 61.9% |
| Swedes | 100.0 /100 | #9 | Exceptional 61.8% |
| Mexicans | 100.0 /100 | #10 | Exceptional 61.7% |
| Dutch | 100.0 /100 | #11 | Exceptional 61.6% |
| Germans | 100.0 /100 | #12 | Exceptional 61.6% |
| Samoans | 100.0 /100 | #13 | Exceptional 61.5% |
| Czechs | 100.0 /100 | #14 | Exceptional 61.5% |
| Nepalese | 100.0 /100 | #15 | Exceptional 61.4% |
| Native Hawaiians | 100.0 /100 | #16 | Exceptional 61.4% |
| Basques | 100.0 /100 | #17 | Exceptional 61.4% |
| Europeans | 100.0 /100 | #18 | Exceptional 61.4% |
| Scottish | 100.0 /100 | #19 | Exceptional 61.2% |
| Sri Lankans | 100.0 /100 | #20 | Exceptional 61.0% |
| Koreans | 100.0 /100 | #21 | Exceptional 61.0% |
| Swiss | 100.0 /100 | #22 | Exceptional 61.0% |