Immigrants from Lithuania vs Immigrants from Serbia 4 or more Vehicles in Household
COMPARE
Immigrants from Lithuania
Immigrants from Serbia
4 or more Vehicles in Household
4 or more Vehicles in Household Comparison
Immigrants from Lithuania
Immigrants from Serbia
5.6%
4 OR MORE VEHICLES IN HOUSEHOLD
1.4/ 100
METRIC RATING
258th/ 347
METRIC RANK
5.0%
4 OR MORE VEHICLES IN HOUSEHOLD
0.0/ 100
METRIC RATING
306th/ 347
METRIC RANK
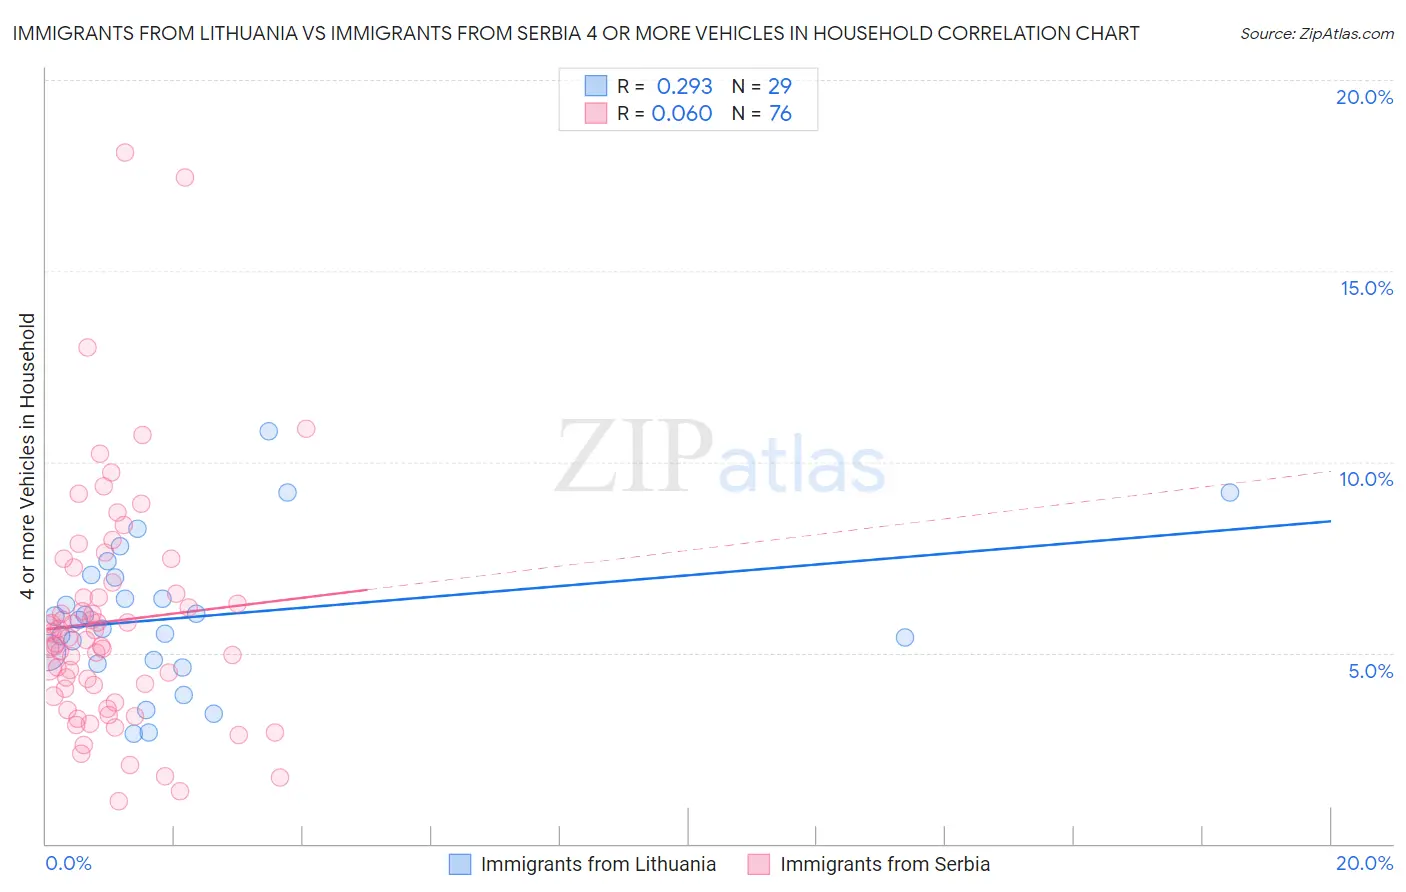
Immigrants from Lithuania vs Immigrants from Serbia 4 or more Vehicles in Household Correlation Chart
The statistical analysis conducted on geographies consisting of 117,416,675 people shows a weak positive correlation between the proportion of Immigrants from Lithuania and percentage of households with 4 or more vehicles available in the United States with a correlation coefficient (R) of 0.293 and weighted average of 5.6%. Similarly, the statistical analysis conducted on geographies consisting of 131,136,431 people shows a slight positive correlation between the proportion of Immigrants from Serbia and percentage of households with 4 or more vehicles available in the United States with a correlation coefficient (R) of 0.060 and weighted average of 5.0%, a difference of 12.3%.
4 or more Vehicles in Household Correlation Summary
| Measurement | Immigrants from Lithuania | Immigrants from Serbia |
| Minimum | 2.9% | 1.1% |
| Maximum | 10.8% | 18.1% |
| Range | 7.9% | 17.0% |
| Mean | 6.0% | 5.8% |
| Median | 5.8% | 5.4% |
| Interquartile 25% (IQ1) | 4.8% | 4.0% |
| Interquartile 75% (IQ3) | 7.0% | 6.7% |
| Interquartile Range (IQR) | 2.2% | 2.7% |
| Standard Deviation (Sample) | 1.9% | 3.1% |
| Standard Deviation (Population) | 1.9% | 3.0% |
Similar Demographics by 4 or more Vehicles in Household
Demographics Similar to Immigrants from Lithuania by 4 or more Vehicles in Household
In terms of 4 or more vehicles in household, the demographic groups most similar to Immigrants from Lithuania are Immigrants from France (5.6%, a difference of 0.030%), Immigrants from Northern Africa (5.6%, a difference of 0.14%), Immigrants from Turkey (5.7%, a difference of 0.22%), Uruguayan (5.6%, a difference of 0.22%), and Yup'ik (5.7%, a difference of 0.25%).
| Demographics | Rating | Rank | 4 or more Vehicles in Household |
| Ugandans | 2.2 /100 | #251 | Tragic 5.7% |
| Sub-Saharan Africans | 2.1 /100 | #252 | Tragic 5.7% |
| Immigrants | Cuba | 1.6 /100 | #253 | Tragic 5.7% |
| Immigrants | Panama | 1.5 /100 | #254 | Tragic 5.7% |
| Yup'ik | 1.5 /100 | #255 | Tragic 5.7% |
| Immigrants | Turkey | 1.5 /100 | #256 | Tragic 5.7% |
| Immigrants | Northern Africa | 1.4 /100 | #257 | Tragic 5.6% |
| Immigrants | Lithuania | 1.4 /100 | #258 | Tragic 5.6% |
| Immigrants | France | 1.3 /100 | #259 | Tragic 5.6% |
| Uruguayans | 1.3 /100 | #260 | Tragic 5.6% |
| Sudanese | 1.2 /100 | #261 | Tragic 5.6% |
| Bermudans | 1.2 /100 | #262 | Tragic 5.6% |
| Immigrants | Saudi Arabia | 1.1 /100 | #263 | Tragic 5.6% |
| Immigrants | Africa | 1.0 /100 | #264 | Tragic 5.6% |
| South Americans | 0.9 /100 | #265 | Tragic 5.6% |
Demographics Similar to Immigrants from Serbia by 4 or more Vehicles in Household
In terms of 4 or more vehicles in household, the demographic groups most similar to Immigrants from Serbia are Cypriot (5.0%, a difference of 0.090%), Somali (5.0%, a difference of 0.090%), Immigrants from Greece (5.1%, a difference of 0.64%), Menominee (5.0%, a difference of 0.94%), and Bahamian (5.1%, a difference of 1.1%).
| Demographics | Rating | Rank | 4 or more Vehicles in Household |
| Immigrants | Ghana | 0.1 /100 | #299 | Tragic 5.2% |
| Immigrants | Morocco | 0.0 /100 | #300 | Tragic 5.1% |
| Immigrants | Zaire | 0.0 /100 | #301 | Tragic 5.1% |
| Bahamians | 0.0 /100 | #302 | Tragic 5.1% |
| Immigrants | Greece | 0.0 /100 | #303 | Tragic 5.1% |
| Cypriots | 0.0 /100 | #304 | Tragic 5.0% |
| Somalis | 0.0 /100 | #305 | Tragic 5.0% |
| Immigrants | Serbia | 0.0 /100 | #306 | Tragic 5.0% |
| Menominee | 0.0 /100 | #307 | Tragic 5.0% |
| Paraguayans | 0.0 /100 | #308 | Tragic 4.9% |
| Immigrants | Somalia | 0.0 /100 | #309 | Tragic 4.9% |
| Moroccans | 0.0 /100 | #310 | Tragic 4.9% |
| Houma | 0.0 /100 | #311 | Tragic 4.9% |
| Albanians | 0.0 /100 | #312 | Tragic 4.8% |
| Immigrants | Israel | 0.0 /100 | #313 | Tragic 4.8% |