Immigrants from Hungary vs Immigrants from Russia No Vehicles in Household
COMPARE
Immigrants from Hungary
Immigrants from Russia
No Vehicles in Household
No Vehicles in Household Comparison
Immigrants from Hungary
Immigrants from Russia
11.1%
NO VEHICLES IN HOUSEHOLD
12.3/ 100
METRIC RATING
213th/ 347
METRIC RANK
15.1%
NO VEHICLES IN HOUSEHOLD
0.0/ 100
METRIC RATING
304th/ 347
METRIC RANK
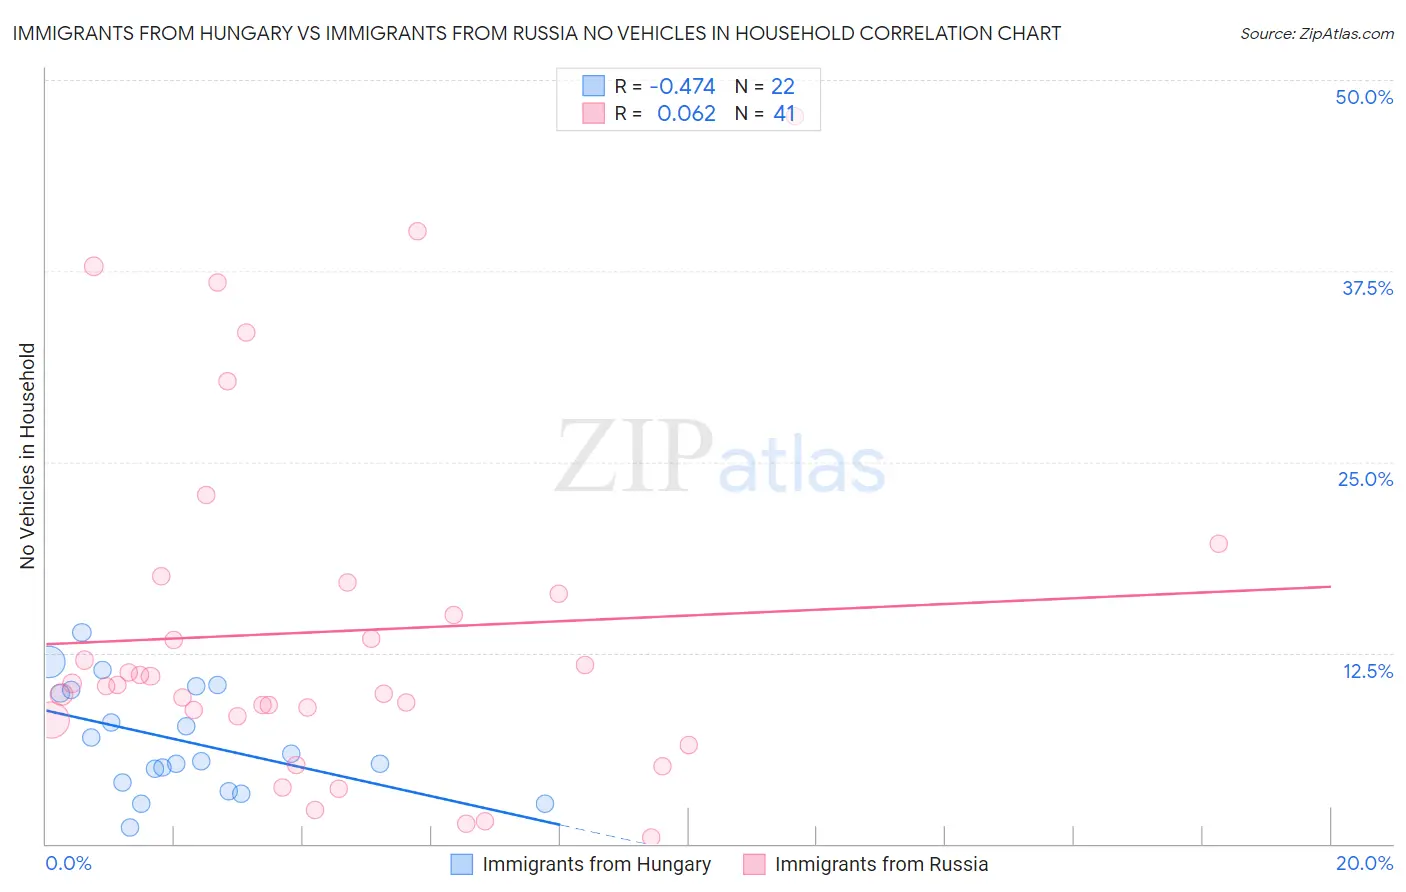
Immigrants from Hungary vs Immigrants from Russia No Vehicles in Household Correlation Chart
The statistical analysis conducted on geographies consisting of 195,539,885 people shows a moderate negative correlation between the proportion of Immigrants from Hungary and percentage of households with no vehicle available in the United States with a correlation coefficient (R) of -0.474 and weighted average of 11.1%. Similarly, the statistical analysis conducted on geographies consisting of 347,176,226 people shows a slight positive correlation between the proportion of Immigrants from Russia and percentage of households with no vehicle available in the United States with a correlation coefficient (R) of 0.062 and weighted average of 15.1%, a difference of 36.1%.
No Vehicles in Household Correlation Summary
| Measurement | Immigrants from Hungary | Immigrants from Russia |
| Minimum | 1.1% | 0.41% |
| Maximum | 13.8% | 47.6% |
| Range | 12.7% | 47.2% |
| Mean | 6.8% | 13.9% |
| Median | 5.7% | 10.4% |
| Interquartile 25% (IQ1) | 4.0% | 8.3% |
| Interquartile 75% (IQ3) | 10.1% | 16.7% |
| Interquartile Range (IQR) | 6.1% | 8.5% |
| Standard Deviation (Sample) | 3.5% | 11.3% |
| Standard Deviation (Population) | 3.4% | 11.1% |
Similar Demographics by No Vehicles in Household
Demographics Similar to Immigrants from Hungary by No Vehicles in Household
In terms of no vehicles in household, the demographic groups most similar to Immigrants from Hungary are Immigrants from Denmark (11.1%, a difference of 0.070%), Immigrants from Western Asia (11.0%, a difference of 0.43%), Crow (11.0%, a difference of 0.52%), Immigrants from Sri Lanka (11.2%, a difference of 0.53%), and Immigrants from Argentina (11.2%, a difference of 0.54%).
| Demographics | Rating | Rank | No Vehicles in Household |
| Somalis | 15.9 /100 | #206 | Poor 11.0% |
| Sierra Leoneans | 15.7 /100 | #207 | Poor 11.0% |
| Immigrants | Italy | 15.6 /100 | #208 | Poor 11.0% |
| Pennsylvania Germans | 15.5 /100 | #209 | Poor 11.0% |
| Apache | 14.8 /100 | #210 | Poor 11.0% |
| Crow | 14.2 /100 | #211 | Poor 11.0% |
| Immigrants | Western Asia | 13.9 /100 | #212 | Poor 11.0% |
| Immigrants | Hungary | 12.3 /100 | #213 | Poor 11.1% |
| Immigrants | Denmark | 12.1 /100 | #214 | Poor 11.1% |
| Immigrants | Sri Lanka | 10.6 /100 | #215 | Poor 11.2% |
| Immigrants | Argentina | 10.6 /100 | #216 | Poor 11.2% |
| Dutch West Indians | 10.2 /100 | #217 | Poor 11.2% |
| Immigrants | Guatemala | 10.0 /100 | #218 | Tragic 11.2% |
| Argentineans | 9.6 /100 | #219 | Tragic 11.2% |
| Immigrants | Zaire | 9.6 /100 | #220 | Tragic 11.2% |
Demographics Similar to Immigrants from Russia by No Vehicles in Household
In terms of no vehicles in household, the demographic groups most similar to Immigrants from Russia are Immigrants from China (15.2%, a difference of 0.38%), Immigrants from Western Africa (15.0%, a difference of 0.66%), Haitian (14.9%, a difference of 1.2%), Immigrants from Ukraine (14.9%, a difference of 1.7%), and Yuman (14.9%, a difference of 1.7%).
| Demographics | Rating | Rank | No Vehicles in Household |
| Immigrants | Panama | 0.0 /100 | #297 | Tragic 14.6% |
| Moroccans | 0.0 /100 | #298 | Tragic 14.7% |
| Immigrants | Greece | 0.0 /100 | #299 | Tragic 14.7% |
| Yuman | 0.0 /100 | #300 | Tragic 14.9% |
| Immigrants | Ukraine | 0.0 /100 | #301 | Tragic 14.9% |
| Haitians | 0.0 /100 | #302 | Tragic 14.9% |
| Immigrants | Western Africa | 0.0 /100 | #303 | Tragic 15.0% |
| Immigrants | Russia | 0.0 /100 | #304 | Tragic 15.1% |
| Immigrants | China | 0.0 /100 | #305 | Tragic 15.2% |
| Immigrants | Belize | 0.0 /100 | #306 | Tragic 15.4% |
| Immigrants | Haiti | 0.0 /100 | #307 | Tragic 15.4% |
| U.S. Virgin Islanders | 0.0 /100 | #308 | Tragic 15.4% |
| Puerto Ricans | 0.0 /100 | #309 | Tragic 15.5% |
| Cape Verdeans | 0.0 /100 | #310 | Tragic 15.6% |
| Immigrants | Israel | 0.0 /100 | #311 | Tragic 15.6% |