Immigrants from Germany vs Malaysian No Vehicles in Household
COMPARE
Immigrants from Germany
Malaysian
No Vehicles in Household
No Vehicles in Household Comparison
Immigrants from Germany
Malaysians
8.7%
NO VEHICLES IN HOUSEHOLD
99.1/ 100
METRIC RATING
91st/ 347
METRIC RANK
7.7%
NO VEHICLES IN HOUSEHOLD
100.0/ 100
METRIC RATING
32nd/ 347
METRIC RANK
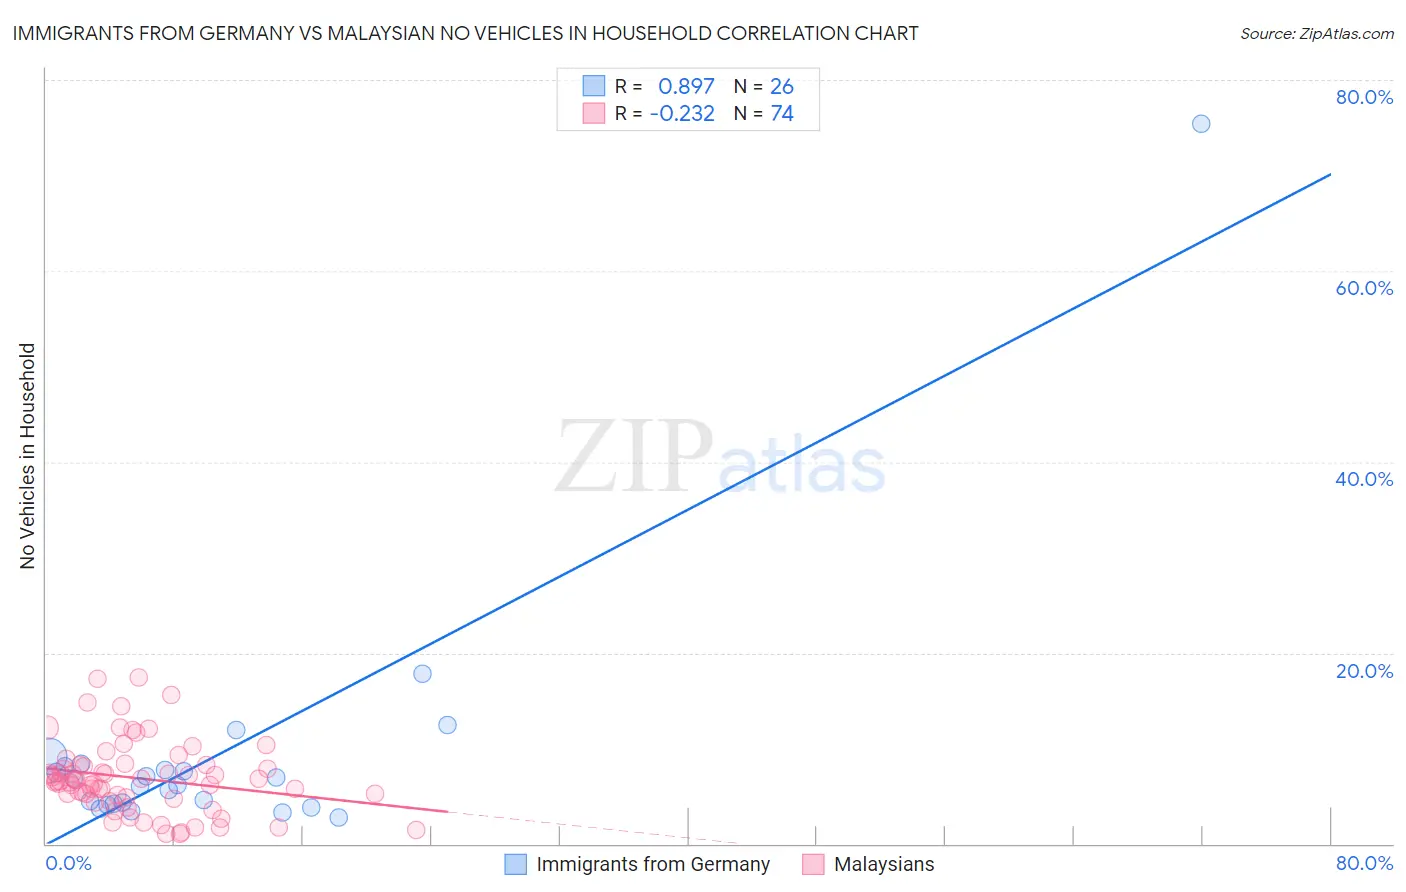
Immigrants from Germany vs Malaysian No Vehicles in Household Correlation Chart
The statistical analysis conducted on geographies consisting of 462,346,961 people shows a very strong positive correlation between the proportion of Immigrants from Germany and percentage of households with no vehicle available in the United States with a correlation coefficient (R) of 0.897 and weighted average of 8.7%. Similarly, the statistical analysis conducted on geographies consisting of 225,868,450 people shows a weak negative correlation between the proportion of Malaysians and percentage of households with no vehicle available in the United States with a correlation coefficient (R) of -0.232 and weighted average of 7.7%, a difference of 13.3%.
No Vehicles in Household Correlation Summary
| Measurement | Immigrants from Germany | Malaysian |
| Minimum | 2.8% | 0.99% |
| Maximum | 75.4% | 17.4% |
| Range | 72.6% | 16.4% |
| Mean | 9.4% | 6.9% |
| Median | 6.4% | 6.6% |
| Interquartile 25% (IQ1) | 4.2% | 4.8% |
| Interquartile 75% (IQ3) | 8.1% | 8.2% |
| Interquartile Range (IQR) | 3.9% | 3.4% |
| Standard Deviation (Sample) | 13.9% | 3.7% |
| Standard Deviation (Population) | 13.6% | 3.7% |
Similar Demographics by No Vehicles in Household
Demographics Similar to Immigrants from Germany by No Vehicles in Household
In terms of no vehicles in household, the demographic groups most similar to Immigrants from Germany are Immigrants from Canada (8.7%, a difference of 0.030%), Immigrants from North America (8.7%, a difference of 0.17%), Bhutanese (8.7%, a difference of 0.19%), Immigrants from Cuba (8.7%, a difference of 0.28%), and Osage (8.7%, a difference of 0.42%).
| Demographics | Rating | Rank | No Vehicles in Household |
| Immigrants | Jordan | 99.3 /100 | #84 | Exceptional 8.7% |
| Lebanese | 99.3 /100 | #85 | Exceptional 8.7% |
| Bangladeshis | 99.3 /100 | #86 | Exceptional 8.7% |
| Immigrants | England | 99.2 /100 | #87 | Exceptional 8.7% |
| Osage | 99.2 /100 | #88 | Exceptional 8.7% |
| Immigrants | Cuba | 99.2 /100 | #89 | Exceptional 8.7% |
| Bhutanese | 99.2 /100 | #90 | Exceptional 8.7% |
| Immigrants | Germany | 99.1 /100 | #91 | Exceptional 8.7% |
| Immigrants | Canada | 99.1 /100 | #92 | Exceptional 8.7% |
| Immigrants | North America | 99.1 /100 | #93 | Exceptional 8.7% |
| Austrians | 98.9 /100 | #94 | Exceptional 8.8% |
| Potawatomi | 98.8 /100 | #95 | Exceptional 8.8% |
| Immigrants | Bolivia | 98.7 /100 | #96 | Exceptional 8.9% |
| Immigrants | Central America | 98.5 /100 | #97 | Exceptional 8.9% |
| Slavs | 98.4 /100 | #98 | Exceptional 9.0% |
Demographics Similar to Malaysians by No Vehicles in Household
In terms of no vehicles in household, the demographic groups most similar to Malaysians are Immigrants from Taiwan (7.7%, a difference of 0.11%), Immigrants from Vietnam (7.7%, a difference of 0.24%), Native Hawaiian (7.7%, a difference of 0.25%), Cherokee (7.7%, a difference of 0.38%), and Finnish (7.7%, a difference of 0.40%).
| Demographics | Rating | Rank | No Vehicles in Household |
| Yaqui | 100.0 /100 | #25 | Exceptional 7.5% |
| Sri Lankans | 100.0 /100 | #26 | Exceptional 7.6% |
| British | 100.0 /100 | #27 | Exceptional 7.6% |
| Samoans | 100.0 /100 | #28 | Exceptional 7.6% |
| Americans | 100.0 /100 | #29 | Exceptional 7.7% |
| Finns | 100.0 /100 | #30 | Exceptional 7.7% |
| Native Hawaiians | 100.0 /100 | #31 | Exceptional 7.7% |
| Malaysians | 100.0 /100 | #32 | Exceptional 7.7% |
| Immigrants | Taiwan | 100.0 /100 | #33 | Exceptional 7.7% |
| Immigrants | Vietnam | 100.0 /100 | #34 | Exceptional 7.7% |
| Cherokee | 99.9 /100 | #35 | Exceptional 7.7% |
| Iraqis | 99.9 /100 | #36 | Exceptional 7.7% |
| Basques | 99.9 /100 | #37 | Exceptional 7.8% |
| Creek | 99.9 /100 | #38 | Exceptional 7.8% |
| Immigrants | Fiji | 99.9 /100 | #39 | Exceptional 7.8% |