Immigrants from Ecuador vs Native/Alaskan 4 or more Vehicles in Household
COMPARE
Immigrants from Ecuador
Native/Alaskan
4 or more Vehicles in Household
4 or more Vehicles in Household Comparison
Immigrants from Ecuador
Natives/Alaskans
4.2%
4 OR MORE VEHICLES IN HOUSEHOLD
0.0/ 100
METRIC RATING
330th/ 347
METRIC RANK
8.2%
4 OR MORE VEHICLES IN HOUSEHOLD
100.0/ 100
METRIC RATING
31st/ 347
METRIC RANK
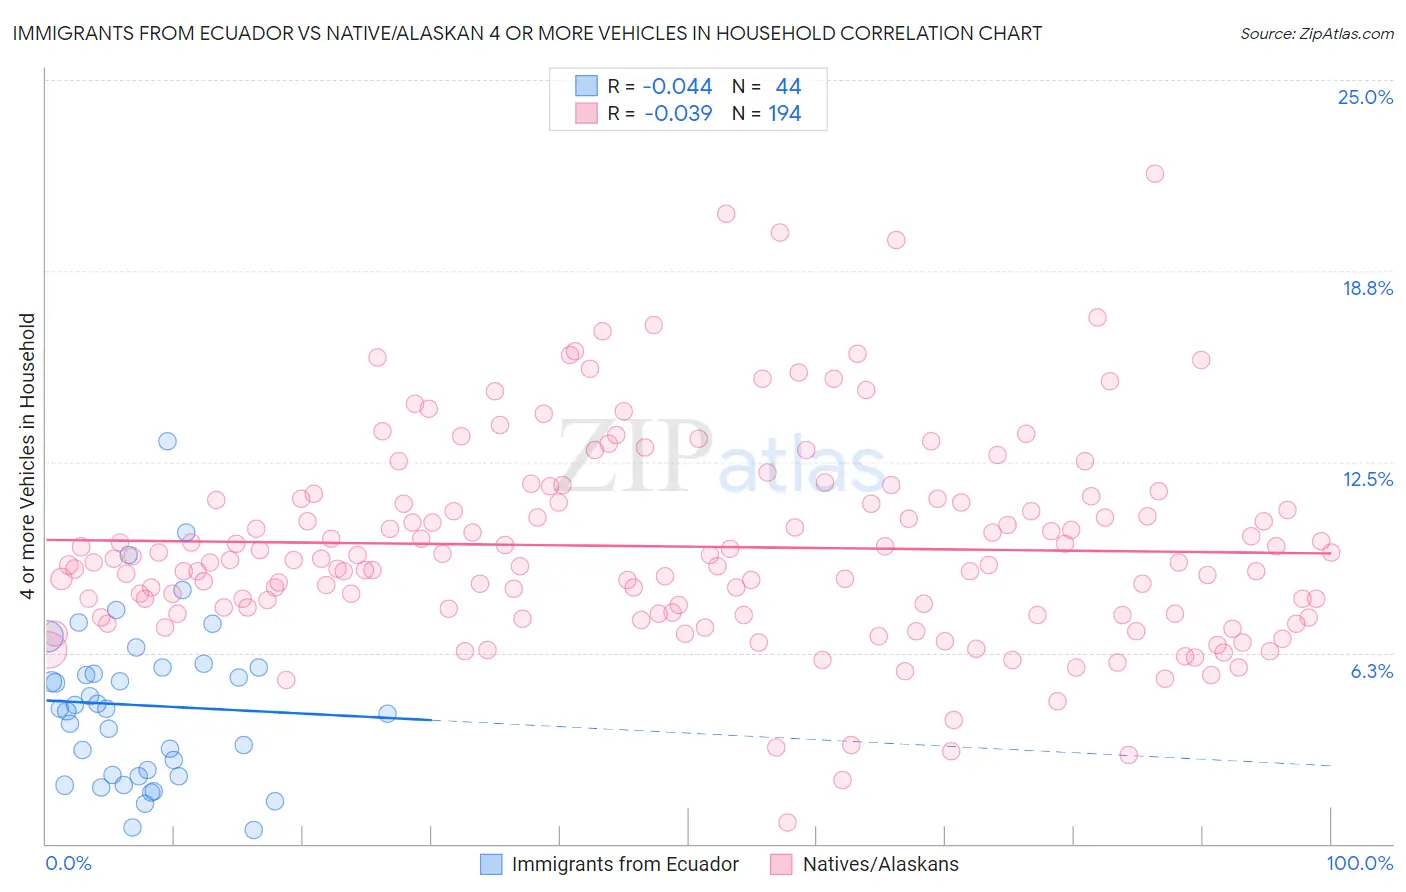
Immigrants from Ecuador vs Native/Alaskan 4 or more Vehicles in Household Correlation Chart
The statistical analysis conducted on geographies consisting of 269,639,406 people shows no correlation between the proportion of Immigrants from Ecuador and percentage of households with 4 or more vehicles available in the United States with a correlation coefficient (R) of -0.044 and weighted average of 4.2%. Similarly, the statistical analysis conducted on geographies consisting of 510,504,827 people shows no correlation between the proportion of Natives/Alaskans and percentage of households with 4 or more vehicles available in the United States with a correlation coefficient (R) of -0.039 and weighted average of 8.2%, a difference of 93.4%.
4 or more Vehicles in Household Correlation Summary
| Measurement | Immigrants from Ecuador | Native/Alaskan |
| Minimum | 0.44% | 0.68% |
| Maximum | 13.2% | 21.9% |
| Range | 12.7% | 21.2% |
| Mean | 4.5% | 9.7% |
| Median | 4.4% | 9.2% |
| Interquartile 25% (IQ1) | 2.2% | 7.5% |
| Interquartile 75% (IQ3) | 5.8% | 11.3% |
| Interquartile Range (IQR) | 3.5% | 3.7% |
| Standard Deviation (Sample) | 2.7% | 3.4% |
| Standard Deviation (Population) | 2.6% | 3.4% |
Similar Demographics by 4 or more Vehicles in Household
Demographics Similar to Immigrants from Ecuador by 4 or more Vehicles in Household
In terms of 4 or more vehicles in household, the demographic groups most similar to Immigrants from Ecuador are Immigrants from Senegal (4.2%, a difference of 0.20%), West Indian (4.2%, a difference of 0.26%), Trinidadian and Tobagonian (4.3%, a difference of 0.47%), Immigrants from Dominica (4.2%, a difference of 1.2%), and Senegalese (4.3%, a difference of 2.1%).
| Demographics | Rating | Rank | 4 or more Vehicles in Household |
| Immigrants | Caribbean | 0.0 /100 | #323 | Tragic 4.4% |
| Soviet Union | 0.0 /100 | #324 | Tragic 4.4% |
| Immigrants | Jamaica | 0.0 /100 | #325 | Tragic 4.4% |
| Cape Verdeans | 0.0 /100 | #326 | Tragic 4.4% |
| Senegalese | 0.0 /100 | #327 | Tragic 4.3% |
| Trinidadians and Tobagonians | 0.0 /100 | #328 | Tragic 4.3% |
| Immigrants | Senegal | 0.0 /100 | #329 | Tragic 4.2% |
| Immigrants | Ecuador | 0.0 /100 | #330 | Tragic 4.2% |
| West Indians | 0.0 /100 | #331 | Tragic 4.2% |
| Immigrants | Dominica | 0.0 /100 | #332 | Tragic 4.2% |
| Immigrants | Albania | 0.0 /100 | #333 | Tragic 4.1% |
| Immigrants | Trinidad and Tobago | 0.0 /100 | #334 | Tragic 4.1% |
| Barbadians | 0.0 /100 | #335 | Tragic 3.9% |
| Immigrants | Bangladesh | 0.0 /100 | #336 | Tragic 3.9% |
| Vietnamese | 0.0 /100 | #337 | Tragic 3.9% |
Demographics Similar to Natives/Alaskans by 4 or more Vehicles in Household
In terms of 4 or more vehicles in household, the demographic groups most similar to Natives/Alaskans are Navajo (8.2%, a difference of 0.40%), Immigrants from South Eastern Asia (8.2%, a difference of 0.43%), Marshallese (8.1%, a difference of 0.53%), Yaqui (8.1%, a difference of 0.82%), and Cheyenne (8.3%, a difference of 1.1%).
| Demographics | Rating | Rank | 4 or more Vehicles in Household |
| Immigrants | Central America | 100.0 /100 | #24 | Exceptional 8.5% |
| Basques | 100.0 /100 | #25 | Exceptional 8.4% |
| Mexican American Indians | 100.0 /100 | #26 | Exceptional 8.4% |
| Sri Lankans | 100.0 /100 | #27 | Exceptional 8.4% |
| Cheyenne | 100.0 /100 | #28 | Exceptional 8.3% |
| Immigrants | South Eastern Asia | 100.0 /100 | #29 | Exceptional 8.2% |
| Navajo | 100.0 /100 | #30 | Exceptional 8.2% |
| Natives/Alaskans | 100.0 /100 | #31 | Exceptional 8.2% |
| Marshallese | 100.0 /100 | #32 | Exceptional 8.1% |
| Yaqui | 100.0 /100 | #33 | Exceptional 8.1% |
| Alaskan Athabascans | 100.0 /100 | #34 | Exceptional 8.1% |
| Guamanians/Chamorros | 100.0 /100 | #35 | Exceptional 8.1% |
| Norwegians | 100.0 /100 | #36 | Exceptional 8.0% |
| Scandinavians | 100.0 /100 | #37 | Exceptional 8.0% |
| Sioux | 100.0 /100 | #38 | Exceptional 8.0% |