Immigrants from Eastern Africa vs Colville 2 or more Vehicles in Household
COMPARE
Immigrants from Eastern Africa
Colville
2 or more Vehicles in Household
2 or more Vehicles in Household Comparison
Immigrants from Eastern Africa
Colville
53.7%
2 OR MORE VEHICLES IN HOUSEHOLD
5.1/ 100
METRIC RATING
226th/ 347
METRIC RANK
55.6%
2 OR MORE VEHICLES IN HOUSEHOLD
61.1/ 100
METRIC RATING
161st/ 347
METRIC RANK
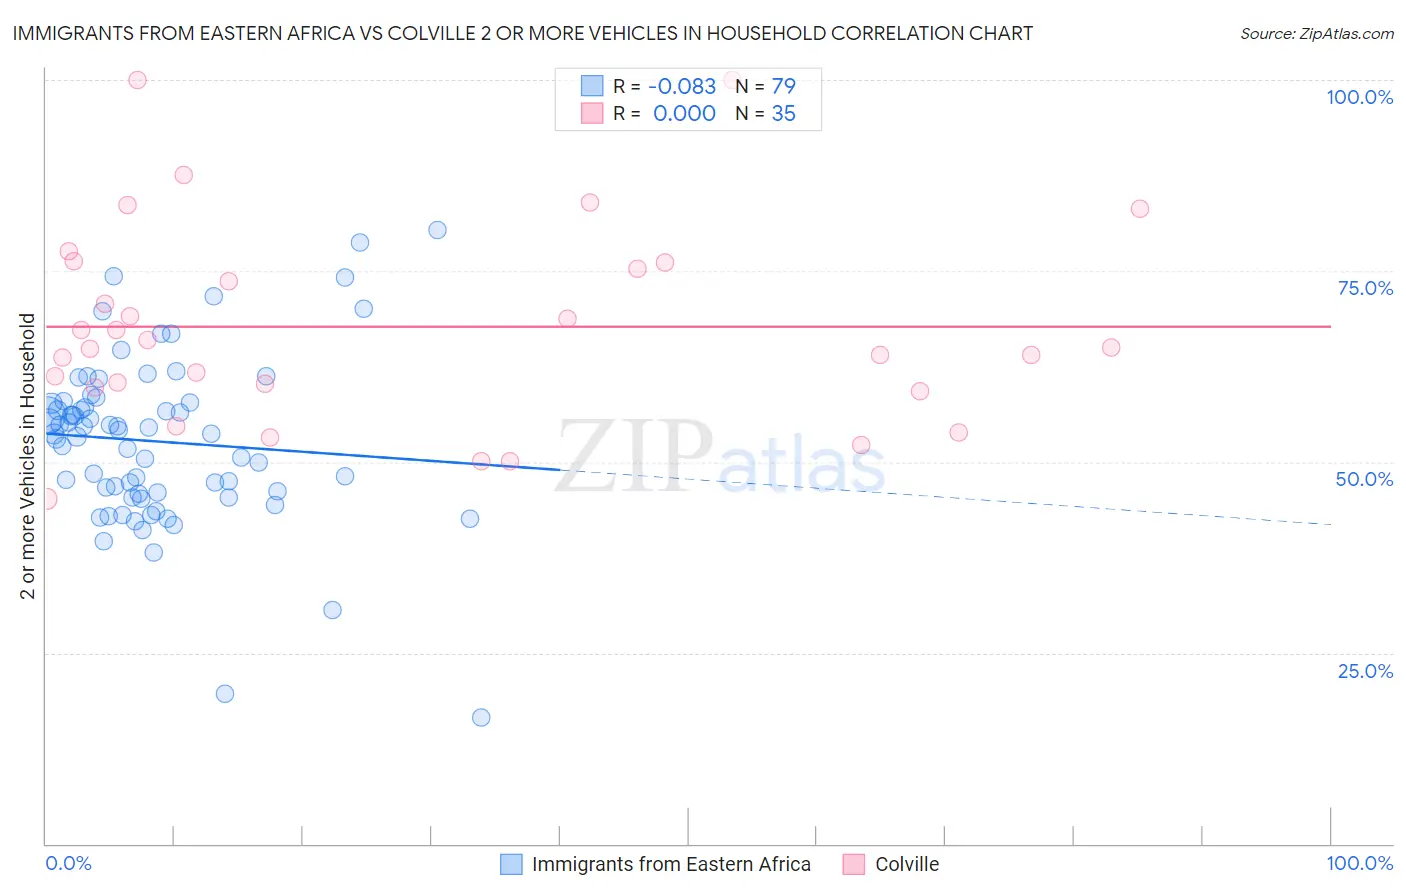
Immigrants from Eastern Africa vs Colville 2 or more Vehicles in Household Correlation Chart
The statistical analysis conducted on geographies consisting of 354,928,878 people shows a slight negative correlation between the proportion of Immigrants from Eastern Africa and percentage of households with 2 or more vehicles available in the United States with a correlation coefficient (R) of -0.083 and weighted average of 53.7%. Similarly, the statistical analysis conducted on geographies consisting of 34,683,092 people shows no correlation between the proportion of Colville and percentage of households with 2 or more vehicles available in the United States with a correlation coefficient (R) of 0.000 and weighted average of 55.6%, a difference of 3.5%.
2 or more Vehicles in Household Correlation Summary
| Measurement | Immigrants from Eastern Africa | Colville |
| Minimum | 16.4% | 45.2% |
| Maximum | 80.4% | 100.0% |
| Range | 63.9% | 54.8% |
| Mean | 52.7% | 67.7% |
| Median | 53.7% | 65.0% |
| Interquartile 25% (IQ1) | 45.9% | 59.8% |
| Interquartile 75% (IQ3) | 57.8% | 76.1% |
| Interquartile Range (IQR) | 11.9% | 16.3% |
| Standard Deviation (Sample) | 11.1% | 13.2% |
| Standard Deviation (Population) | 11.0% | 13.0% |
Similar Demographics by 2 or more Vehicles in Household
Demographics Similar to Immigrants from Eastern Africa by 2 or more Vehicles in Household
In terms of 2 or more vehicles in household, the demographic groups most similar to Immigrants from Eastern Africa are Immigrants from Egypt (53.8%, a difference of 0.020%), Brazilian (53.8%, a difference of 0.030%), Immigrants from Bosnia and Herzegovina (53.8%, a difference of 0.070%), Kiowa (53.9%, a difference of 0.20%), and Immigrants from Singapore (53.9%, a difference of 0.21%).
| Demographics | Rating | Rank | 2 or more Vehicles in Household |
| South American Indians | 6.5 /100 | #219 | Tragic 53.9% |
| Taiwanese | 6.3 /100 | #220 | Tragic 53.9% |
| Immigrants | Singapore | 6.3 /100 | #221 | Tragic 53.9% |
| Kiowa | 6.2 /100 | #222 | Tragic 53.9% |
| Immigrants | Bosnia and Herzegovina | 5.5 /100 | #223 | Tragic 53.8% |
| Brazilians | 5.3 /100 | #224 | Tragic 53.8% |
| Immigrants | Egypt | 5.2 /100 | #225 | Tragic 53.8% |
| Immigrants | Eastern Africa | 5.1 /100 | #226 | Tragic 53.7% |
| Sudanese | 4.1 /100 | #227 | Tragic 53.6% |
| Alaska Natives | 3.9 /100 | #228 | Tragic 53.6% |
| Immigrants | Turkey | 3.8 /100 | #229 | Tragic 53.6% |
| Immigrants | Nepal | 3.6 /100 | #230 | Tragic 53.5% |
| Panamanians | 3.4 /100 | #231 | Tragic 53.5% |
| Immigrants | Guatemala | 3.2 /100 | #232 | Tragic 53.5% |
| Ugandans | 3.2 /100 | #233 | Tragic 53.5% |
Demographics Similar to Colville by 2 or more Vehicles in Household
In terms of 2 or more vehicles in household, the demographic groups most similar to Colville are German Russian (55.6%, a difference of 0.010%), Immigrants from Zimbabwe (55.6%, a difference of 0.040%), Dutch West Indian (55.6%, a difference of 0.050%), Immigrants from El Salvador (55.6%, a difference of 0.070%), and Immigrants from Sri Lanka (55.5%, a difference of 0.12%).
| Demographics | Rating | Rank | 2 or more Vehicles in Household |
| Ukrainians | 70.8 /100 | #154 | Good 55.8% |
| Immigrants | Venezuela | 70.7 /100 | #155 | Good 55.8% |
| Immigrants | Lithuania | 70.4 /100 | #156 | Good 55.8% |
| Immigrants | Kuwait | 70.2 /100 | #157 | Good 55.8% |
| Tlingit-Haida | 68.5 /100 | #158 | Good 55.8% |
| Paiute | 68.0 /100 | #159 | Good 55.8% |
| Crow | 67.0 /100 | #160 | Good 55.7% |
| Colville | 61.1 /100 | #161 | Good 55.6% |
| German Russians | 60.9 /100 | #162 | Good 55.6% |
| Immigrants | Zimbabwe | 60.2 /100 | #163 | Good 55.6% |
| Dutch West Indians | 59.8 /100 | #164 | Average 55.6% |
| Immigrants | El Salvador | 59.4 /100 | #165 | Average 55.6% |
| Immigrants | Sri Lanka | 58.3 /100 | #166 | Average 55.5% |
| Kenyans | 58.1 /100 | #167 | Average 55.5% |
| French American Indians | 56.7 /100 | #168 | Average 55.5% |