Immigrants from Denmark vs Immigrants from Eastern Europe 3 or more Vehicles in Household

COMPARE

Immigrants from Denmark
Race
Ancestry
AfghanAfricanAlaska NativeAlaskan AthabascanAlbanianAleutAlsatianAmericanApacheArabArapahoArgentineanArmenianAssyrian/Chaldean/SyriacAustralianAustrianBahamianBangladeshiBarbadianBasqueBelgianBelizeanBermudanBhutaneseBlackfeetBolivianBrazilianBritishBritish West IndianBulgarianBurmeseCajunCambodianCanadianCape VerdeanCarpatho RusynCelticCentral AmericanCentral American IndianCherokeeCheyenneChickasawChileanChineseChippewaChoctawColombianColvilleComancheCosta RicanCreeCreekCroatianCrowCubanCypriotCzechCzechoslovakianDanishDelawareDominicanDutchDutch West IndianEastern EuropeanEcuadorianEgyptianEnglishEstonianEthiopianEuropeanFijianFilipinoFinnishFrenchFrench American IndianFrench CanadianGermanGerman RussianGhanaianGreekGuamanian/ChamorroGuatemalanGuyaneseHaitianHmongHonduranHopiHoumaHungarianIcelanderIndian (Asian)IndonesianInupiatIranianIraqiIrishIroquoisIsraeliItalianJamaicanJapaneseJordanianKenyanKiowaKoreanLaotianLatvianLebaneseLiberianLithuanianLumbeeLuxembourgerMacedonianMalaysianMalteseMarshalleseMenomineeMexicanMexican American IndianMongolianMoroccanNative HawaiianNavajoNepaleseNew ZealanderNicaraguanNigerianNorthern EuropeanNorwegianOkinawanOsageOttawaPaiutePakistaniPalestinianPanamanianParaguayanPennsylvania GermanPeruvianPimaPolishPortuguesePotawatomiPuebloPuerto RicanPuget Sound SalishRomanianRussianSalvadoranSamoanScandinavianScotch-IrishScottishSeminoleSenegaleseSerbianShoshoneSierra LeoneanSiouxSlavicSlovakSloveneSomaliSouth AfricanSouth AmericanSouth American IndianSoviet UnionSpaniardSpanishSpanish AmericanSpanish American IndianSri LankanSubsaharan AfricanSudaneseSwedishSwissSyrianTaiwaneseThaiTlingit-HaidaTohono O'OdhamTonganTrinidadian and TobagonianTsimshianTurkishU.S. Virgin IslanderUgandanUkrainianUruguayanUteVenezuelanVietnameseWelshWest IndianYakamaYaquiYugoslavianYumanYup'ikZimbabwean
Immigration
NonimmigrantsImmigrantsAfghanistanAfricaAlbaniaArgentinaArmeniaAsiaAustraliaAustriaBahamasBangladeshBarbadosBelarusBelgiumBelizeBoliviaBosnia and HerzegovinaBrazilBulgariaBurma/MyanmarCabo VerdeCambodiaCameroonCanadaCaribbeanCentral AmericaChileChinaColombiaCongoCosta RicaCroatiaCubaCzechoslovakiaDenmarkDominicaDominican RepublicEastern AfricaEastern AsiaEcuadorEgyptEl SalvadorEnglandEritreaEthiopiaEuropeFijiFranceGermanyGhanaGreeceGrenadaGuatemalaGuyanaHaitiHondurasHong KongHungaryIndiaIndonesiaIranIraqIrelandIsraelItalyJamaicaJapanJordanKazakhstanKenyaKoreaKuwaitLaosLatin AmericaLatviaLebanonLiberiaLithuaniaMalaysiaMexicoMicronesiaMiddle AfricaMoldovaMoroccoNepalNetherlandsNicaraguaNigeriaNorth AmericaNorth MacedoniaNorthern AfricaNorthern EuropeNorwayOceaniaPakistanPanamaPeruPhilippinesPolandPortugalRomaniaRussiaSaudi ArabiaScotlandSenegalSerbiaSierra LeoneSingaporeSomaliaSouth AfricaSouth AmericaSouth Central AsiaSouth Eastern AsiaSouthern EuropeSpainSri LankaSt. Vincent and the GrenadinesSudanSwedenSwitzerlandSyriaTaiwanThailandTrinidad and TobagoTurkeyUgandaUkraineUruguayUzbekistanVenezuelaVietnamWest IndiesWestern AfricaWestern AsiaWestern EuropeYemenZaireZimbabweAzores
Immigrants from Eastern Europe
Race
Ancestry
AfghanAfricanAlaska NativeAlaskan AthabascanAlbanianAleutAlsatianAmericanApacheArabArapahoArgentineanArmenianAssyrian/Chaldean/SyriacAustralianAustrianBahamianBangladeshiBarbadianBasqueBelgianBelizeanBermudanBhutaneseBlackfeetBolivianBrazilianBritishBritish West IndianBulgarianBurmeseCajunCambodianCanadianCape VerdeanCarpatho RusynCelticCentral AmericanCentral American IndianCherokeeCheyenneChickasawChileanChineseChippewaChoctawColombianColvilleComancheCosta RicanCreeCreekCroatianCrowCubanCypriotCzechCzechoslovakianDanishDelawareDominicanDutchDutch West IndianEastern EuropeanEcuadorianEgyptianEnglishEstonianEthiopianEuropeanFijianFilipinoFinnishFrenchFrench American IndianFrench CanadianGermanGerman RussianGhanaianGreekGuamanian/ChamorroGuatemalanGuyaneseHaitianHmongHonduranHopiHoumaHungarianIcelanderIndian (Asian)IndonesianInupiatIranianIraqiIrishIroquoisIsraeliItalianJamaicanJapaneseJordanianKenyanKiowaKoreanLaotianLatvianLebaneseLiberianLithuanianLumbeeLuxembourgerMacedonianMalaysianMalteseMarshalleseMenomineeMexicanMexican American IndianMongolianMoroccanNative HawaiianNavajoNepaleseNew ZealanderNicaraguanNigerianNorthern EuropeanNorwegianOkinawanOsageOttawaPaiutePakistaniPalestinianPanamanianParaguayanPennsylvania GermanPeruvianPimaPolishPortuguesePotawatomiPuebloPuerto RicanPuget Sound SalishRomanianRussianSalvadoranSamoanScandinavianScotch-IrishScottishSeminoleSenegaleseSerbianShoshoneSierra LeoneanSiouxSlavicSlovakSloveneSomaliSouth AfricanSouth AmericanSouth American IndianSoviet UnionSpaniardSpanishSpanish AmericanSpanish American IndianSri LankanSubsaharan AfricanSudaneseSwedishSwissSyrianTaiwaneseThaiTlingit-HaidaTohono O'OdhamTonganTrinidadian and TobagonianTsimshianTurkishU.S. Virgin IslanderUgandanUkrainianUruguayanUteVenezuelanVietnameseWelshWest IndianYakamaYaquiYugoslavianYumanYup'ikZimbabwean
Immigration
NonimmigrantsImmigrantsAfghanistanAfricaAlbaniaArgentinaArmeniaAsiaAustraliaAustriaBahamasBangladeshBarbadosBelarusBelgiumBelizeBoliviaBosnia and HerzegovinaBrazilBulgariaBurma/MyanmarCabo VerdeCambodiaCameroonCanadaCaribbeanCentral AmericaChileChinaColombiaCongoCosta RicaCroatiaCubaCzechoslovakiaDominicaDominican RepublicEastern AfricaEastern AsiaEastern EuropeEcuadorEgyptEl SalvadorEnglandEritreaEthiopiaEuropeFijiFranceGermanyGhanaGreeceGrenadaGuatemalaGuyanaHaitiHondurasHong KongHungaryIndiaIndonesiaIranIraqIrelandIsraelItalyJamaicaJapanJordanKazakhstanKenyaKoreaKuwaitLaosLatin AmericaLatviaLebanonLiberiaLithuaniaMalaysiaMexicoMicronesiaMiddle AfricaMoldovaMoroccoNepalNetherlandsNicaraguaNigeriaNorth AmericaNorth MacedoniaNorthern AfricaNorthern EuropeNorwayOceaniaPakistanPanamaPeruPhilippinesPolandPortugalRomaniaRussiaSaudi ArabiaScotlandSenegalSerbiaSierra LeoneSingaporeSomaliaSouth AfricaSouth AmericaSouth Central AsiaSouth Eastern AsiaSouthern EuropeSpainSri LankaSt. Vincent and the GrenadinesSudanSwedenSwitzerlandSyriaTaiwanThailandTrinidad and TobagoTurkeyUgandaUkraineUruguayUzbekistanVenezuelaVietnamWest IndiesWestern AfricaWestern AsiaWestern EuropeYemenZaireZimbabweAzores
3 or more Vehicles in Household
Income
Poverty
Unemployment
Labor Participation
Family Structure
Vehicle Availability
Education Level
Disability

3 or more Vehicles in Household Comparison

Immigrants from Denmark

Immigrants from Eastern Europe

Average
Tragic
19.6%
3 OR MORE VEHICLES IN HOUSEHOLD
57.6/ 100
METRIC RATING
169th/ 347
METRIC RANK
17.4%
3 OR MORE VEHICLES IN HOUSEHOLD
0.3/ 100
METRIC RATING
280th/ 347
METRIC RANK

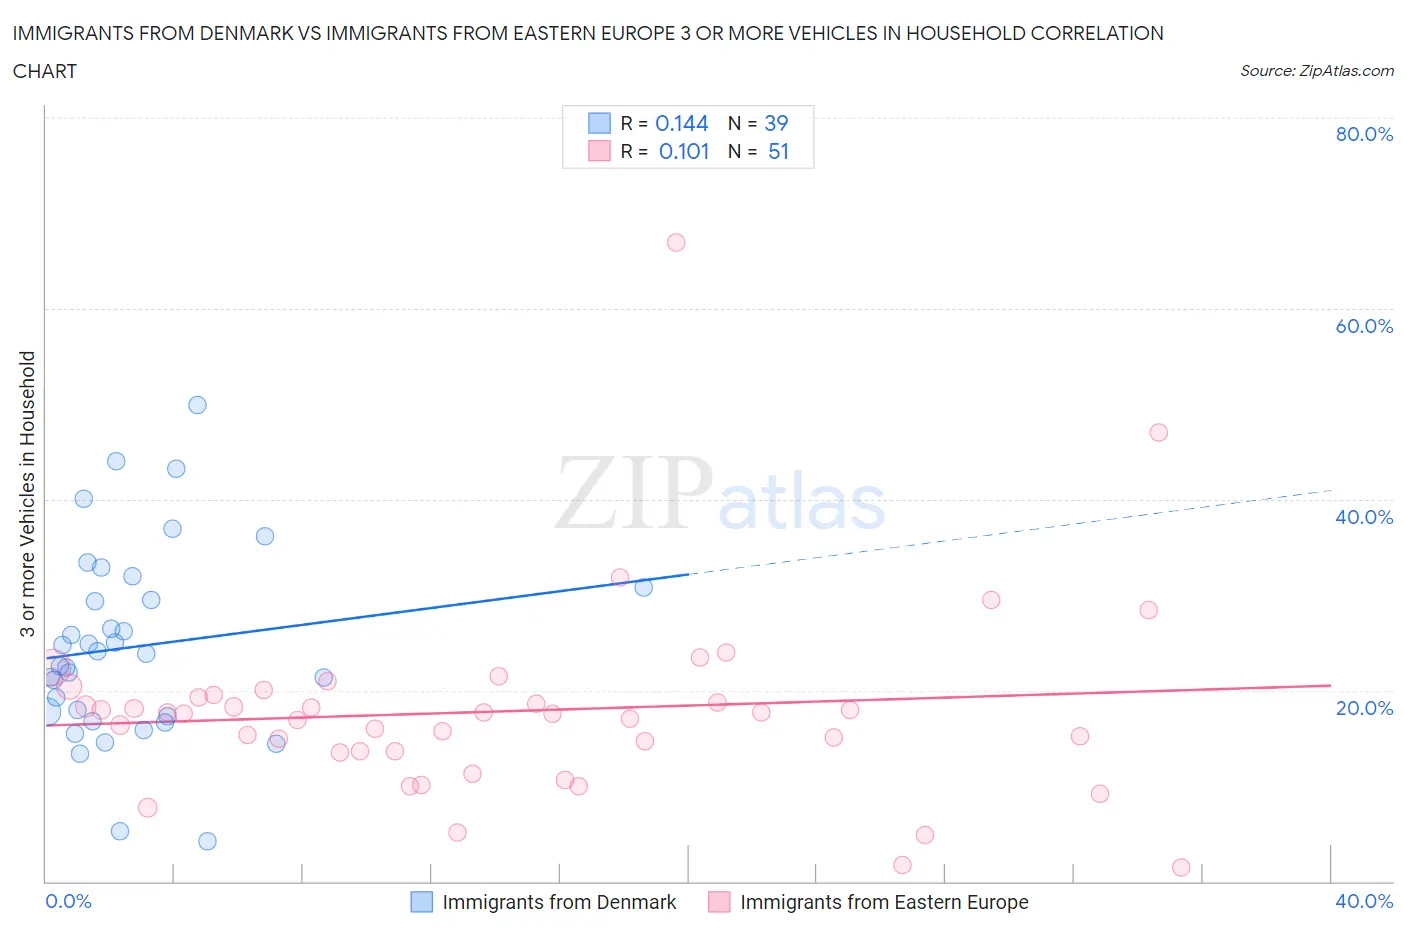
Immigrants from Denmark vs Immigrants from Eastern Europe 3 or more Vehicles in Household Correlation Chart

The statistical analysis conducted on geographies consisting of 136,395,357 people shows a poor positive correlation between the proportion of Immigrants from Denmark and percentage of households with 3 or more vehicles available in the United States with a correlation coefficient (R) of 0.144 and weighted average of 19.6%. Similarly, the statistical analysis conducted on geographies consisting of 475,306,541 people shows a poor positive correlation between the proportion of Immigrants from Eastern Europe and percentage of households with 3 or more vehicles available in the United States with a correlation coefficient (R) of 0.101 and weighted average of 17.4%, a difference of 12.7%.
Immigrants from Denmark vs Immigrants from Eastern Europe 3 or more Vehicles in Household

3 or more Vehicles in Household Correlation Summary

MeasurementImmigrants from DenmarkImmigrants from Eastern Europe
Minimum4.2%1.4%
Maximum49.9%66.9%
Range45.7%65.5%
Mean24.6%17.8%
Median23.8%17.6%
Interquartile 25% (IQ1)17.2%13.6%
Interquartile 75% (IQ3)30.8%19.5%
Interquartile Range (IQR)13.5%5.9%
Standard Deviation (Sample)10.0%10.3%
Standard Deviation (Population)9.9%10.2%

Similar Demographics by 3 or more Vehicles in Household

Demographics Similar to Immigrants from Denmark by 3 or more Vehicles in Household

In terms of 3 or more vehicles in household, the demographic groups most similar to Immigrants from Denmark are Peruvian (19.6%, a difference of 0.090%), Ukrainian (19.6%, a difference of 0.10%), Iraqi (19.6%, a difference of 0.13%), Immigrants from Cameroon (19.7%, a difference of 0.25%), and Immigrants from Costa Rica (19.7%, a difference of 0.33%).
DemographicsRating | Rank3 or more Vehicles in Household
Estonians
63.2
/100
|
#162
Good
19.7%
Chileans
63.0
/100
|
#163
Good
19.7%
Yugoslavians
62.9
/100
|
#164
Good
19.7%
Immigrants | Costa Rica
61.9
/100
|
#165
Good
19.7%
Immigrants | Cameroon
60.9
/100
|
#166
Good
19.7%
Ukrainians
58.9
/100
|
#167
Average
19.6%
Peruvians
58.8
/100
|
#168
Average
19.6%
Immigrants | Denmark
57.6
/100
|
#169
Average
19.6%
Iraqis
56.0
/100
|
#170
Average
19.6%
Immigrants | Western Europe
53.2
/100
|
#171
Average
19.5%
Kiowa
50.9
/100
|
#172
Average
19.5%
Immigrants | Northern Europe
50.2
/100
|
#173
Average
19.5%
Immigrants | South Africa
50.0
/100
|
#174
Average
19.5%
Syrians
47.0
/100
|
#175
Average
19.5%
Iroquois
46.0
/100
|
#176
Average
19.4%

Demographics Similar to Immigrants from Eastern Europe by 3 or more Vehicles in Household

In terms of 3 or more vehicles in household, the demographic groups most similar to Immigrants from Eastern Europe are Immigrants from Kazakhstan (17.4%, a difference of 0.040%), Immigrants from Latvia (17.4%, a difference of 0.040%), Immigrants from Bahamas (17.4%, a difference of 0.050%), Brazilian (17.4%, a difference of 0.14%), and Okinawan (17.4%, a difference of 0.29%).
DemographicsRating | Rank3 or more Vehicles in Household
Immigrants | Sudan
0.5
/100
|
#273
Tragic
17.6%
Immigrants | Bosnia and Herzegovina
0.5
/100
|
#274
Tragic
17.5%
Immigrants | Ukraine
0.4
/100
|
#275
Tragic
17.5%
Okinawans
0.4
/100
|
#276
Tragic
17.4%
Brazilians
0.4
/100
|
#277
Tragic
17.4%
Immigrants | Bahamas
0.3
/100
|
#278
Tragic
17.4%
Immigrants | Kazakhstan
0.3
/100
|
#279
Tragic
17.4%
Immigrants | Eastern Europe
0.3
/100
|
#280
Tragic
17.4%
Immigrants | Latvia
0.3
/100
|
#281
Tragic
17.4%
Immigrants | Ireland
0.3
/100
|
#282
Tragic
17.3%
Blacks/African Americans
0.3
/100
|
#283
Tragic
17.3%
Immigrants | Colombia
0.3
/100
|
#284
Tragic
17.3%
Immigrants | Croatia
0.2
/100
|
#285
Tragic
17.2%
Menominee
0.2
/100
|
#286
Tragic
17.2%
Immigrants | Brazil
0.2
/100
|
#287
Tragic
17.1%