Immigrants from Colombia vs Immigrants from Barbados No Vehicles in Household
COMPARE
Immigrants from Colombia
Immigrants from Barbados
No Vehicles in Household
No Vehicles in Household Comparison
Immigrants from Colombia
Immigrants from Barbados
10.5%
NO VEHICLES IN HOUSEHOLD
44.1/ 100
METRIC RATING
181st/ 347
METRIC RANK
29.5%
NO VEHICLES IN HOUSEHOLD
0.0/ 100
METRIC RATING
340th/ 347
METRIC RANK
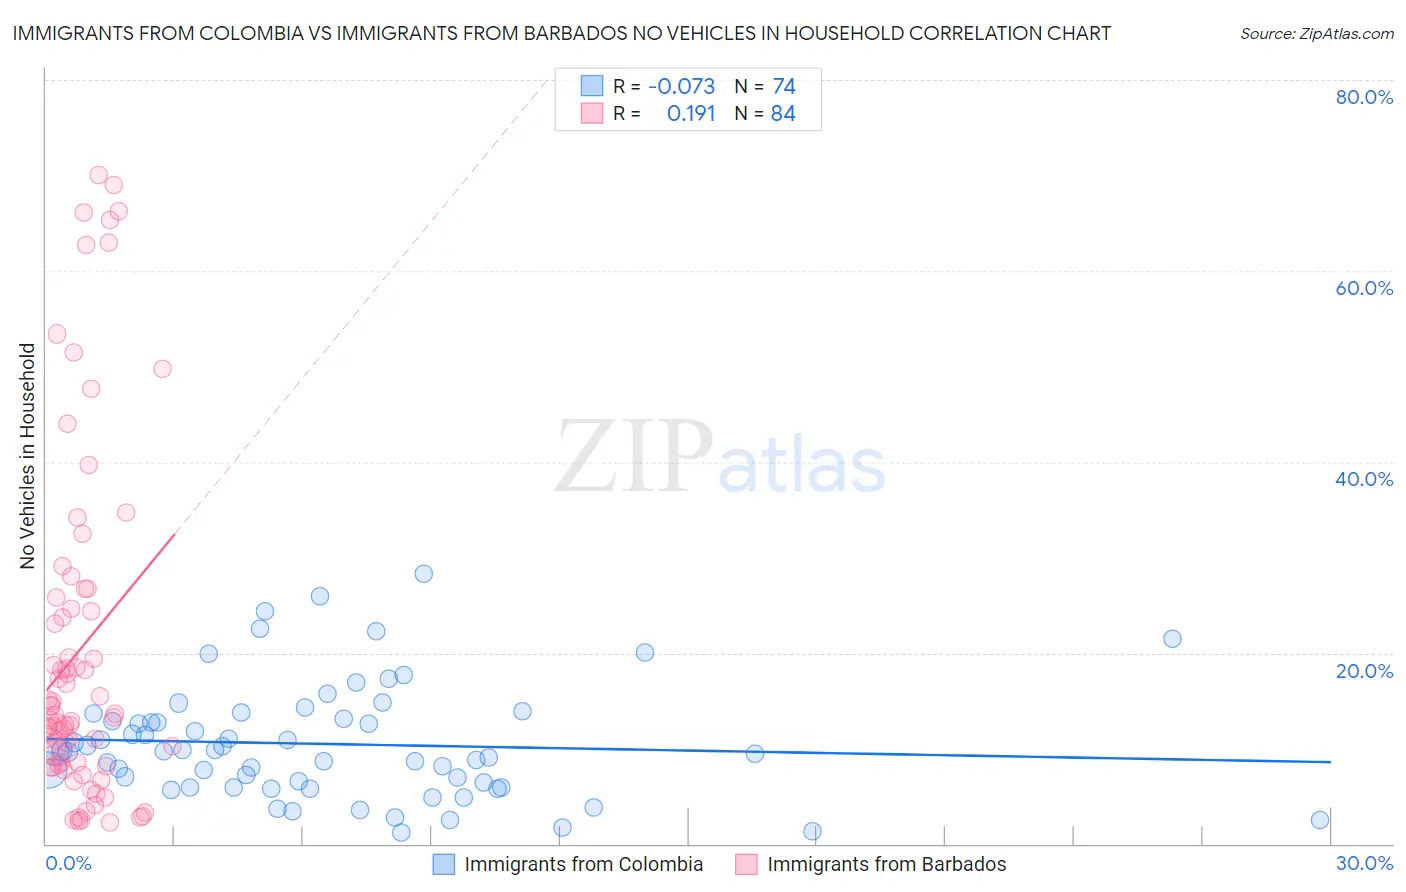
Immigrants from Colombia vs Immigrants from Barbados No Vehicles in Household Correlation Chart
The statistical analysis conducted on geographies consisting of 362,333,216 people shows a slight negative correlation between the proportion of Immigrants from Colombia and percentage of households with no vehicle available in the United States with a correlation coefficient (R) of -0.073 and weighted average of 10.5%. Similarly, the statistical analysis conducted on geographies consisting of 112,757,088 people shows a poor positive correlation between the proportion of Immigrants from Barbados and percentage of households with no vehicle available in the United States with a correlation coefficient (R) of 0.191 and weighted average of 29.5%, a difference of 181.0%.
No Vehicles in Household Correlation Summary
| Measurement | Immigrants from Colombia | Immigrants from Barbados |
| Minimum | 1.2% | 2.2% |
| Maximum | 28.2% | 70.0% |
| Range | 27.0% | 67.8% |
| Mean | 10.5% | 20.3% |
| Median | 9.7% | 13.4% |
| Interquartile 25% (IQ1) | 5.9% | 8.3% |
| Interquartile 75% (IQ3) | 13.1% | 25.2% |
| Interquartile Range (IQR) | 7.2% | 16.9% |
| Standard Deviation (Sample) | 5.9% | 18.1% |
| Standard Deviation (Population) | 5.9% | 18.0% |
Similar Demographics by No Vehicles in Household
Demographics Similar to Immigrants from Colombia by No Vehicles in Household
In terms of no vehicles in household, the demographic groups most similar to Immigrants from Colombia are Immigrants from Bulgaria (10.5%, a difference of 0.040%), Native/Alaskan (10.5%, a difference of 0.060%), Arab (10.5%, a difference of 0.16%), Ethiopian (10.5%, a difference of 0.22%), and Immigrants from Nepal (10.5%, a difference of 0.23%).
| Demographics | Rating | Rank | No Vehicles in Household |
| Immigrants | Sudan | 50.0 /100 | #174 | Average 10.4% |
| Immigrants | Burma/Myanmar | 49.1 /100 | #175 | Average 10.4% |
| French American Indians | 49.1 /100 | #176 | Average 10.4% |
| Immigrants | El Salvador | 49.1 /100 | #177 | Average 10.4% |
| Immigrants | Ethiopia | 48.0 /100 | #178 | Average 10.4% |
| Ethiopians | 45.8 /100 | #179 | Average 10.5% |
| Arabs | 45.3 /100 | #180 | Average 10.5% |
| Immigrants | Colombia | 44.1 /100 | #181 | Average 10.5% |
| Immigrants | Bulgaria | 43.8 /100 | #182 | Average 10.5% |
| Natives/Alaskans | 43.7 /100 | #183 | Average 10.5% |
| Immigrants | Nepal | 42.4 /100 | #184 | Average 10.5% |
| South Americans | 41.9 /100 | #185 | Average 10.5% |
| German Russians | 40.6 /100 | #186 | Average 10.5% |
| Immigrants | Poland | 38.4 /100 | #187 | Fair 10.6% |
| Immigrants | Armenia | 37.5 /100 | #188 | Fair 10.6% |
Demographics Similar to Immigrants from Barbados by No Vehicles in Household
In terms of no vehicles in household, the demographic groups most similar to Immigrants from Barbados are Immigrants from Guyana (29.5%, a difference of 0.050%), Dominican (29.4%, a difference of 0.23%), Guyanese (29.3%, a difference of 0.59%), British West Indian (29.7%, a difference of 0.90%), and Inupiat (29.9%, a difference of 1.3%).
| Demographics | Rating | Rank | No Vehicles in Household |
| Immigrants | Trinidad and Tobago | 0.0 /100 | #333 | Tragic 24.6% |
| Immigrants | Bangladesh | 0.0 /100 | #334 | Tragic 25.8% |
| Barbadians | 0.0 /100 | #335 | Tragic 26.1% |
| Vietnamese | 0.0 /100 | #336 | Tragic 26.2% |
| Immigrants | Uzbekistan | 0.0 /100 | #337 | Tragic 26.7% |
| Guyanese | 0.0 /100 | #338 | Tragic 29.3% |
| Dominicans | 0.0 /100 | #339 | Tragic 29.4% |
| Immigrants | Barbados | 0.0 /100 | #340 | Tragic 29.5% |
| Immigrants | Guyana | 0.0 /100 | #341 | Tragic 29.5% |
| British West Indians | 0.0 /100 | #342 | Tragic 29.7% |
| Inupiat | 0.0 /100 | #343 | Tragic 29.9% |
| Immigrants | Dominican Republic | 0.0 /100 | #344 | Tragic 31.4% |
| Immigrants | St. Vincent and the Grenadines | 0.0 /100 | #345 | Tragic 35.4% |
| Immigrants | Grenada | 0.0 /100 | #346 | Tragic 37.5% |
| Yup'ik | 0.0 /100 | #347 | Tragic 45.9% |