Immigrants from China vs Colombian No Vehicles in Household

COMPARE

Immigrants from China
Race
Ancestry
AfghanAfricanAlaska NativeAlaskan AthabascanAlbanianAleutAlsatianAmericanApacheArabArapahoArgentineanArmenianAssyrian/Chaldean/SyriacAustralianAustrianBahamianBangladeshiBarbadianBasqueBelgianBelizeanBermudanBhutaneseBlackfeetBolivianBrazilianBritishBritish West IndianBulgarianBurmeseCajunCambodianCanadianCape VerdeanCarpatho RusynCelticCentral AmericanCentral American IndianCherokeeCheyenneChickasawChileanChineseChippewaChoctawColvilleComancheCosta RicanCreeCreekCroatianCrowCubanCypriotCzechCzechoslovakianDanishDelawareDominicanDutchDutch West IndianEastern EuropeanEcuadorianEgyptianEnglishEstonianEthiopianEuropeanFijianFilipinoFinnishFrenchFrench American IndianFrench CanadianGermanGerman RussianGhanaianGreekGuamanian/ChamorroGuatemalanGuyaneseHaitianHmongHonduranHopiHoumaHungarianIcelanderIndian (Asian)IndonesianInupiatIranianIraqiIrishIroquoisIsraeliItalianJamaicanJapaneseJordanianKenyanKiowaKoreanLaotianLatvianLebaneseLiberianLithuanianLumbeeLuxembourgerMacedonianMalaysianMalteseMarshalleseMenomineeMexicanMexican American IndianMongolianMoroccanNative HawaiianNavajoNepaleseNew ZealanderNicaraguanNigerianNorthern EuropeanNorwegianOkinawanOsageOttawaPaiutePakistaniPalestinianPanamanianParaguayanPennsylvania GermanPeruvianPimaPolishPortuguesePotawatomiPuebloPuerto RicanPuget Sound SalishRomanianRussianSalvadoranSamoanScandinavianScotch-IrishScottishSeminoleSenegaleseSerbianShoshoneSierra LeoneanSiouxSlavicSlovakSloveneSomaliSouth AfricanSouth AmericanSouth American IndianSoviet UnionSpaniardSpanishSpanish AmericanSpanish American IndianSri LankanSubsaharan AfricanSudaneseSwedishSwissSyrianTaiwaneseThaiTlingit-HaidaTohono O'OdhamTonganTrinidadian and TobagonianTsimshianTurkishU.S. Virgin IslanderUgandanUkrainianUruguayanUteVenezuelanVietnameseWelshWest IndianYakamaYaquiYugoslavianYumanYup'ikZimbabwean
Immigration
NonimmigrantsImmigrantsAfghanistanAfricaAlbaniaArgentinaArmeniaAsiaAustraliaAustriaBahamasBangladeshBarbadosBelarusBelgiumBelizeBoliviaBosnia and HerzegovinaBrazilBulgariaBurma/MyanmarCabo VerdeCambodiaCameroonCanadaCaribbeanCentral AmericaChileChinaColombiaCongoCosta RicaCroatiaCubaCzechoslovakiaDenmarkDominicaDominican RepublicEastern AfricaEastern AsiaEastern EuropeEcuadorEgyptEl SalvadorEnglandEritreaEthiopiaEuropeFijiFranceGermanyGhanaGreeceGrenadaGuatemalaGuyanaHaitiHondurasHong KongHungaryIndiaIndonesiaIranIraqIrelandIsraelItalyJamaicaJapanJordanKazakhstanKenyaKoreaKuwaitLaosLatin AmericaLatviaLebanonLiberiaLithuaniaMalaysiaMexicoMicronesiaMiddle AfricaMoldovaMoroccoNepalNetherlandsNicaraguaNigeriaNorth AmericaNorth MacedoniaNorthern AfricaNorthern EuropeNorwayOceaniaPakistanPanamaPeruPhilippinesPolandPortugalRomaniaRussiaSaudi ArabiaScotlandSenegalSerbiaSierra LeoneSingaporeSomaliaSouth AfricaSouth AmericaSouth Central AsiaSouth Eastern AsiaSouthern EuropeSpainSri LankaSt. Vincent and the GrenadinesSudanSwedenSwitzerlandSyriaTaiwanThailandTrinidad and TobagoTurkeyUgandaUkraineUruguayUzbekistanVenezuelaVietnamWest IndiesWestern AfricaWestern AsiaWestern EuropeYemenZaireZimbabweAzores
Colombian
Race
Ancestry
AfghanAfricanAlaska NativeAlaskan AthabascanAlbanianAleutAlsatianAmericanApacheArabArapahoArgentineanArmenianAssyrian/Chaldean/SyriacAustralianAustrianBahamianBangladeshiBarbadianBasqueBelgianBelizeanBermudanBhutaneseBlackfeetBolivianBrazilianBritishBritish West IndianBulgarianBurmeseCajunCambodianCanadianCape VerdeanCarpatho RusynCelticCentral AmericanCentral American IndianCherokeeCheyenneChickasawChileanChineseChippewaChoctawColombianColvilleComancheCosta RicanCreeCreekCroatianCrowCubanCypriotCzechCzechoslovakianDanishDelawareDominicanDutchDutch West IndianEastern EuropeanEcuadorianEgyptianEnglishEstonianEthiopianEuropeanFijianFilipinoFinnishFrenchFrench American IndianFrench CanadianGermanGerman RussianGhanaianGreekGuamanian/ChamorroGuatemalanGuyaneseHaitianHmongHonduranHopiHoumaHungarianIcelanderIndian (Asian)IndonesianInupiatIranianIraqiIrishIroquoisIsraeliItalianJamaicanJapaneseJordanianKenyanKiowaKoreanLaotianLatvianLebaneseLiberianLithuanianLumbeeLuxembourgerMacedonianMalaysianMalteseMarshalleseMenomineeMexicanMexican American IndianMongolianMoroccanNative HawaiianNavajoNepaleseNew ZealanderNicaraguanNigerianNorthern EuropeanNorwegianOkinawanOsageOttawaPaiutePakistaniPalestinianPanamanianParaguayanPennsylvania GermanPeruvianPimaPolishPortuguesePotawatomiPuebloPuerto RicanPuget Sound SalishRomanianRussianSalvadoranSamoanScandinavianScotch-IrishScottishSeminoleSenegaleseSerbianShoshoneSierra LeoneanSiouxSlavicSlovakSloveneSomaliSouth AfricanSouth AmericanSouth American IndianSoviet UnionSpaniardSpanishSpanish AmericanSpanish American IndianSri LankanSubsaharan AfricanSudaneseSwedishSwissSyrianTaiwaneseThaiTlingit-HaidaTohono O'OdhamTonganTrinidadian and TobagonianTsimshianTurkishU.S. Virgin IslanderUgandanUkrainianUruguayanUteVenezuelanVietnameseWelshWest IndianYakamaYaquiYugoslavianYumanYup'ikZimbabwean
Immigration
NonimmigrantsImmigrantsAfghanistanAfricaAlbaniaArgentinaArmeniaAsiaAustraliaAustriaBahamasBangladeshBarbadosBelarusBelgiumBelizeBoliviaBosnia and HerzegovinaBrazilBulgariaBurma/MyanmarCabo VerdeCambodiaCameroonCanadaCaribbeanCentral AmericaChileColombiaCongoCosta RicaCroatiaCubaCzechoslovakiaDenmarkDominicaDominican RepublicEastern AfricaEastern AsiaEastern EuropeEcuadorEgyptEl SalvadorEnglandEritreaEthiopiaEuropeFijiFranceGermanyGhanaGreeceGrenadaGuatemalaGuyanaHaitiHondurasHong KongHungaryIndiaIndonesiaIranIraqIrelandIsraelItalyJamaicaJapanJordanKazakhstanKenyaKoreaKuwaitLaosLatin AmericaLatviaLebanonLiberiaLithuaniaMalaysiaMexicoMicronesiaMiddle AfricaMoldovaMoroccoNepalNetherlandsNicaraguaNigeriaNorth AmericaNorth MacedoniaNorthern AfricaNorthern EuropeNorwayOceaniaPakistanPanamaPeruPhilippinesPolandPortugalRomaniaRussiaSaudi ArabiaScotlandSenegalSerbiaSierra LeoneSingaporeSomaliaSouth AfricaSouth AmericaSouth Central AsiaSouth Eastern AsiaSouthern EuropeSpainSri LankaSt. Vincent and the GrenadinesSudanSwedenSwitzerlandSyriaTaiwanThailandTrinidad and TobagoTurkeyUgandaUkraineUruguayUzbekistanVenezuelaVietnamWest IndiesWestern AfricaWestern AsiaWestern EuropeYemenZaireZimbabweAzores
No Vehicles in Household
Income
Poverty
Unemployment
Labor Participation
Family Structure
Vehicle Availability
Education Level
Disability

No Vehicles in Household Comparison

Immigrants from China

Colombians

Tragic
Good
15.2%
NO VEHICLES IN HOUSEHOLD
0.0/ 100
METRIC RATING
305th/ 347
METRIC RANK
10.0%
NO VEHICLES IN HOUSEHOLD
73.9/ 100
METRIC RATING
150th/ 347
METRIC RANK

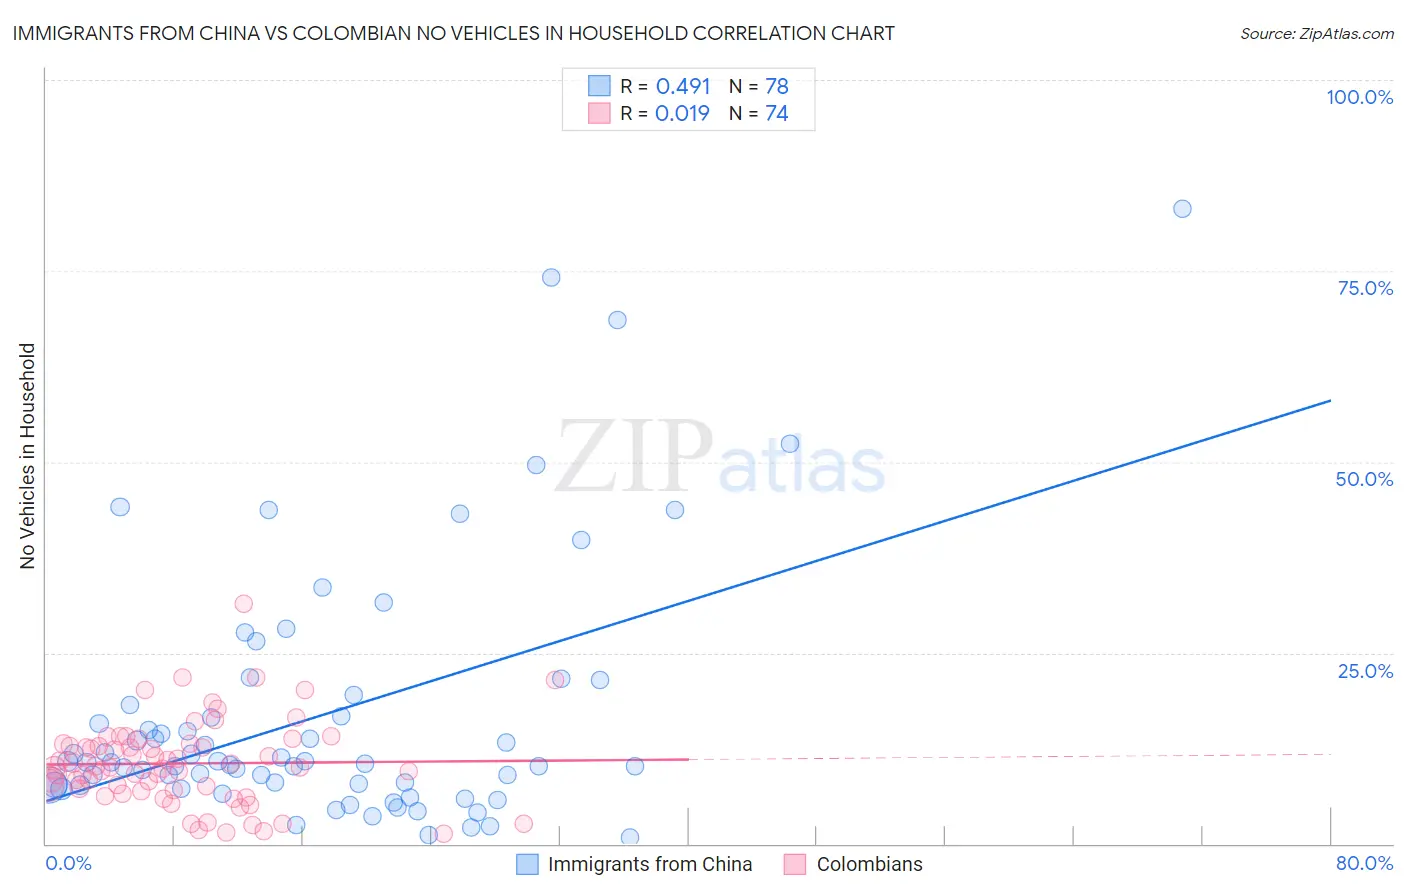
Immigrants from China vs Colombian No Vehicles in Household Correlation Chart

The statistical analysis conducted on geographies consisting of 455,244,510 people shows a moderate positive correlation between the proportion of Immigrants from China and percentage of households with no vehicle available in the United States with a correlation coefficient (R) of 0.491 and weighted average of 15.2%. Similarly, the statistical analysis conducted on geographies consisting of 403,339,443 people shows no correlation between the proportion of Colombians and percentage of households with no vehicle available in the United States with a correlation coefficient (R) of 0.019 and weighted average of 10.0%, a difference of 51.0%.
Immigrants from China vs Colombian No Vehicles in Household

No Vehicles in Household Correlation Summary

MeasurementImmigrants from ChinaColombian
Minimum0.81%1.4%
Maximum83.2%31.4%
Range82.4%30.0%
Mean16.9%10.5%
Median10.7%10.0%
Interquartile 25% (IQ1)7.7%7.0%
Interquartile 75% (IQ3)18.2%13.0%
Interquartile Range (IQR)10.5%6.0%
Standard Deviation (Sample)16.7%5.5%
Standard Deviation (Population)16.6%5.5%

Similar Demographics by No Vehicles in Household

Demographics Similar to Immigrants from China by No Vehicles in Household

In terms of no vehicles in household, the demographic groups most similar to Immigrants from China are Immigrants from Russia (15.1%, a difference of 0.38%), Immigrants from Western Africa (15.0%, a difference of 1.0%), Immigrants from Belize (15.4%, a difference of 1.3%), Immigrants from Haiti (15.4%, a difference of 1.5%), and U.S. Virgin Islander (15.4%, a difference of 1.5%).
DemographicsRating | RankNo Vehicles in Household
Moroccans
0.0
/100
|
#298
Tragic
14.7%
Immigrants | Greece
0.0
/100
|
#299
Tragic
14.7%
Yuman
0.0
/100
|
#300
Tragic
14.9%
Immigrants | Ukraine
0.0
/100
|
#301
Tragic
14.9%
Haitians
0.0
/100
|
#302
Tragic
14.9%
Immigrants | Western Africa
0.0
/100
|
#303
Tragic
15.0%
Immigrants | Russia
0.0
/100
|
#304
Tragic
15.1%
Immigrants | China
0.0
/100
|
#305
Tragic
15.2%
Immigrants | Belize
0.0
/100
|
#306
Tragic
15.4%
Immigrants | Haiti
0.0
/100
|
#307
Tragic
15.4%
U.S. Virgin Islanders
0.0
/100
|
#308
Tragic
15.4%
Puerto Ricans
0.0
/100
|
#309
Tragic
15.5%
Cape Verdeans
0.0
/100
|
#310
Tragic
15.6%
Immigrants | Israel
0.0
/100
|
#311
Tragic
15.6%
Alaskan Athabascans
0.0
/100
|
#312
Tragic
15.6%

Demographics Similar to Colombians by No Vehicles in Household

In terms of no vehicles in household, the demographic groups most similar to Colombians are Immigrants from Eastern Africa (10.0%, a difference of 0.010%), Immigrants from Congo (10.1%, a difference of 0.15%), Tlingit-Haida (10.1%, a difference of 0.24%), Sioux (10.1%, a difference of 0.26%), and Salvadoran (10.1%, a difference of 0.27%).
DemographicsRating | RankNo Vehicles in Household
Chileans
81.2
/100
|
#143
Excellent
9.9%
Immigrants | Bahamas
81.2
/100
|
#144
Excellent
9.9%
Bahamians
81.0
/100
|
#145
Excellent
9.9%
Hungarians
80.0
/100
|
#146
Excellent
9.9%
Immigrants | Nicaragua
79.8
/100
|
#147
Good
9.9%
Immigrants | Bosnia and Herzegovina
79.1
/100
|
#148
Good
9.9%
Immigrants | Uganda
76.1
/100
|
#149
Good
10.0%
Colombians
73.9
/100
|
#150
Good
10.0%
Immigrants | Eastern Africa
73.8
/100
|
#151
Good
10.0%
Immigrants | Congo
73.0
/100
|
#152
Good
10.1%
Tlingit-Haida
72.5
/100
|
#153
Good
10.1%
Sioux
72.4
/100
|
#154
Good
10.1%
Salvadorans
72.4
/100
|
#155
Good
10.1%
Immigrants | Micronesia
70.9
/100
|
#156
Good
10.1%
Australians
70.6
/100
|
#157
Good
10.1%