Immigrants from Bosnia and Herzegovina vs Immigrants from South Eastern Asia No Vehicles in Household
COMPARE
Immigrants from Bosnia and Herzegovina
Immigrants from South Eastern Asia
No Vehicles in Household
No Vehicles in Household Comparison
Immigrants from Bosnia and Herzegovina
Immigrants from South Eastern Asia
9.9%
NO VEHICLES IN HOUSEHOLD
79.1/ 100
METRIC RATING
148th/ 347
METRIC RANK
8.6%
NO VEHICLES IN HOUSEHOLD
99.4/ 100
METRIC RATING
82nd/ 347
METRIC RANK
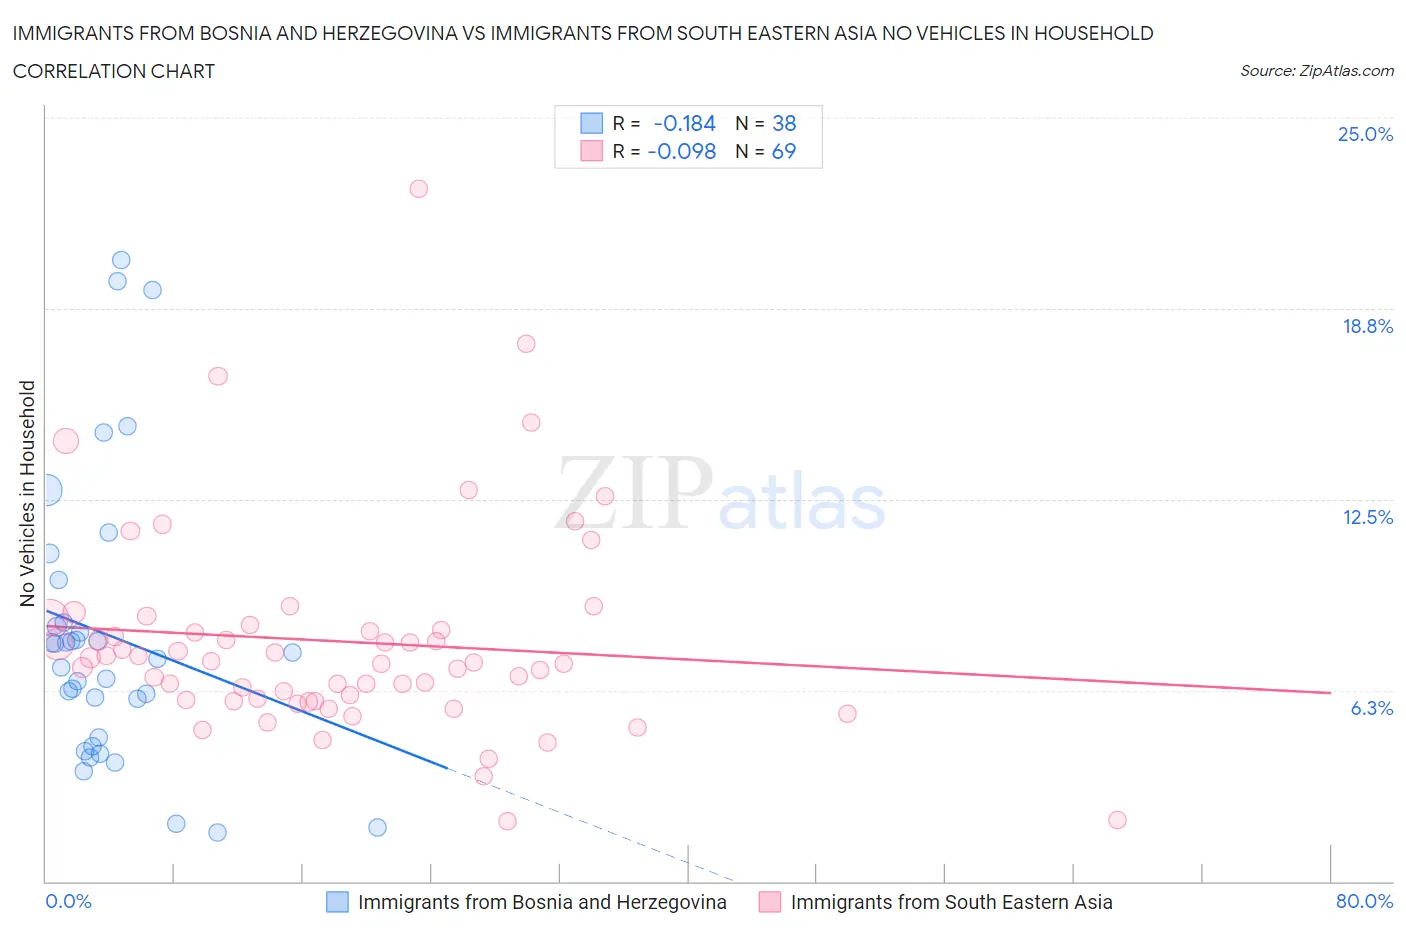
Immigrants from Bosnia and Herzegovina vs Immigrants from South Eastern Asia No Vehicles in Household Correlation Chart
The statistical analysis conducted on geographies consisting of 156,763,936 people shows a poor negative correlation between the proportion of Immigrants from Bosnia and Herzegovina and percentage of households with no vehicle available in the United States with a correlation coefficient (R) of -0.184 and weighted average of 9.9%. Similarly, the statistical analysis conducted on geographies consisting of 510,199,602 people shows a slight negative correlation between the proportion of Immigrants from South Eastern Asia and percentage of households with no vehicle available in the United States with a correlation coefficient (R) of -0.098 and weighted average of 8.6%, a difference of 15.5%.
No Vehicles in Household Correlation Summary
| Measurement | Immigrants from Bosnia and Herzegovina | Immigrants from South Eastern Asia |
| Minimum | 1.6% | 2.0% |
| Maximum | 20.3% | 22.7% |
| Range | 18.7% | 20.7% |
| Mean | 8.0% | 7.8% |
| Median | 7.4% | 7.2% |
| Interquartile 25% (IQ1) | 4.7% | 5.9% |
| Interquartile 75% (IQ3) | 8.5% | 8.3% |
| Interquartile Range (IQR) | 3.8% | 2.4% |
| Standard Deviation (Sample) | 4.6% | 3.4% |
| Standard Deviation (Population) | 4.6% | 3.4% |
Similar Demographics by No Vehicles in Household
Demographics Similar to Immigrants from Bosnia and Herzegovina by No Vehicles in Household
In terms of no vehicles in household, the demographic groups most similar to Immigrants from Bosnia and Herzegovina are Immigrants from Nicaragua (9.9%, a difference of 0.15%), Hungarian (9.9%, a difference of 0.20%), Bahamian (9.9%, a difference of 0.43%), Chilean (9.9%, a difference of 0.46%), and Immigrants from Bahamas (9.9%, a difference of 0.46%).
| Demographics | Rating | Rank | No Vehicles in Household |
| Sudanese | 83.1 /100 | #141 | Excellent 9.8% |
| Immigrants | Zimbabwe | 82.6 /100 | #142 | Excellent 9.9% |
| Chileans | 81.2 /100 | #143 | Excellent 9.9% |
| Immigrants | Bahamas | 81.2 /100 | #144 | Excellent 9.9% |
| Bahamians | 81.0 /100 | #145 | Excellent 9.9% |
| Hungarians | 80.0 /100 | #146 | Excellent 9.9% |
| Immigrants | Nicaragua | 79.8 /100 | #147 | Good 9.9% |
| Immigrants | Bosnia and Herzegovina | 79.1 /100 | #148 | Good 9.9% |
| Immigrants | Uganda | 76.1 /100 | #149 | Good 10.0% |
| Colombians | 73.9 /100 | #150 | Good 10.0% |
| Immigrants | Eastern Africa | 73.8 /100 | #151 | Good 10.0% |
| Immigrants | Congo | 73.0 /100 | #152 | Good 10.1% |
| Tlingit-Haida | 72.5 /100 | #153 | Good 10.1% |
| Sioux | 72.4 /100 | #154 | Good 10.1% |
| Salvadorans | 72.4 /100 | #155 | Good 10.1% |
Demographics Similar to Immigrants from South Eastern Asia by No Vehicles in Household
In terms of no vehicles in household, the demographic groups most similar to Immigrants from South Eastern Asia are Tsimshian (8.6%, a difference of 0.13%), Bolivian (8.6%, a difference of 0.18%), Portuguese (8.6%, a difference of 0.33%), Italian (8.6%, a difference of 0.34%), and Immigrants from South Central Asia (8.6%, a difference of 0.39%).
| Demographics | Rating | Rank | No Vehicles in Household |
| Jordanians | 99.5 /100 | #75 | Exceptional 8.5% |
| Immigrants | Philippines | 99.5 /100 | #76 | Exceptional 8.5% |
| Iranians | 99.5 /100 | #77 | Exceptional 8.6% |
| Immigrants | South Central Asia | 99.5 /100 | #78 | Exceptional 8.6% |
| Portuguese | 99.5 /100 | #79 | Exceptional 8.6% |
| Bolivians | 99.4 /100 | #80 | Exceptional 8.6% |
| Tsimshian | 99.4 /100 | #81 | Exceptional 8.6% |
| Immigrants | South Eastern Asia | 99.4 /100 | #82 | Exceptional 8.6% |
| Italians | 99.4 /100 | #83 | Exceptional 8.6% |
| Immigrants | Jordan | 99.3 /100 | #84 | Exceptional 8.7% |
| Lebanese | 99.3 /100 | #85 | Exceptional 8.7% |
| Bangladeshis | 99.3 /100 | #86 | Exceptional 8.7% |
| Immigrants | England | 99.2 /100 | #87 | Exceptional 8.7% |
| Osage | 99.2 /100 | #88 | Exceptional 8.7% |
| Immigrants | Cuba | 99.2 /100 | #89 | Exceptional 8.7% |