Immigrants from the Azores vs Immigrants from South Central Asia 2 or more Vehicles in Household
COMPARE
Immigrants from the Azores
Immigrants from South Central Asia
2 or more Vehicles in Household
2 or more Vehicles in Household Comparison
Immigrants from the Azores
Immigrants from South Central Asia
56.4%
2 OR MORE VEHICLES IN HOUSEHOLD
86.6/ 100
METRIC RATING
134th/ 347
METRIC RANK
56.6%
2 OR MORE VEHICLES IN HOUSEHOLD
90.5/ 100
METRIC RATING
128th/ 347
METRIC RANK
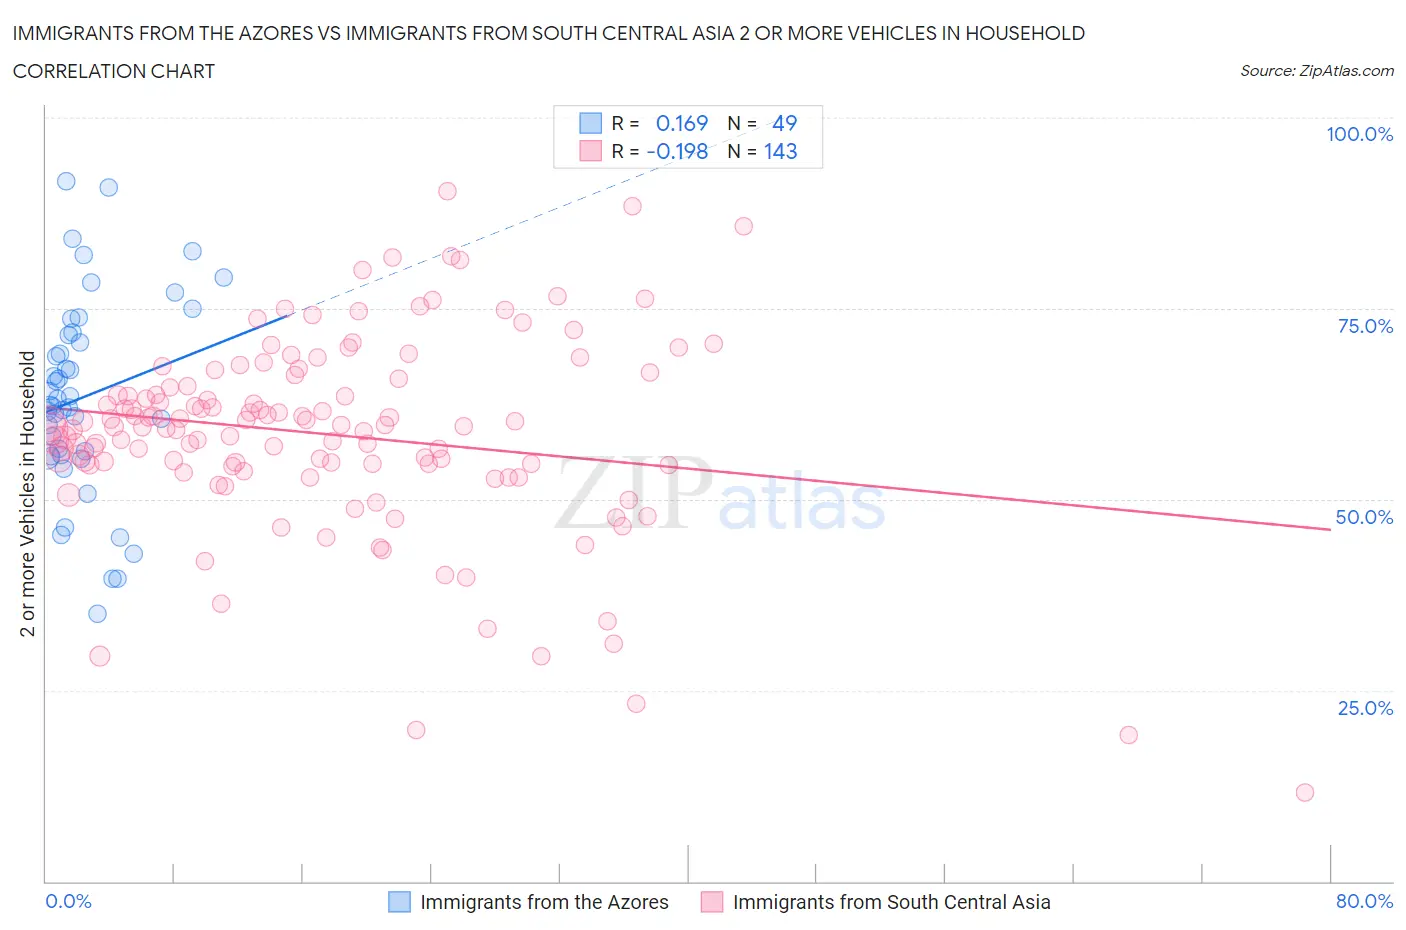
Immigrants from the Azores vs Immigrants from South Central Asia 2 or more Vehicles in Household Correlation Chart
The statistical analysis conducted on geographies consisting of 46,257,310 people shows a poor positive correlation between the proportion of Immigrants from the Azores and percentage of households with 2 or more vehicles available in the United States with a correlation coefficient (R) of 0.169 and weighted average of 56.4%. Similarly, the statistical analysis conducted on geographies consisting of 472,708,525 people shows a poor negative correlation between the proportion of Immigrants from South Central Asia and percentage of households with 2 or more vehicles available in the United States with a correlation coefficient (R) of -0.198 and weighted average of 56.6%, a difference of 0.38%.
2 or more Vehicles in Household Correlation Summary
| Measurement | Immigrants from the Azores | Immigrants from South Central Asia |
| Minimum | 35.0% | 11.6% |
| Maximum | 91.6% | 90.3% |
| Range | 56.6% | 78.7% |
| Mean | 63.4% | 58.5% |
| Median | 62.3% | 59.5% |
| Interquartile 25% (IQ1) | 55.7% | 54.4% |
| Interquartile 75% (IQ3) | 71.7% | 64.8% |
| Interquartile Range (IQR) | 15.9% | 10.4% |
| Standard Deviation (Sample) | 12.9% | 12.9% |
| Standard Deviation (Population) | 12.7% | 12.9% |
Demographics Similar to Immigrants from the Azores and Immigrants from South Central Asia by 2 or more Vehicles in Household
In terms of 2 or more vehicles in household, the demographic groups most similar to Immigrants from the Azores are Blackfeet (56.4%, a difference of 0.010%), Immigrants from Asia (56.3%, a difference of 0.050%), Cuban (56.3%, a difference of 0.14%), Salvadoran (56.3%, a difference of 0.15%), and Comanche (56.5%, a difference of 0.16%). Similarly, the demographic groups most similar to Immigrants from South Central Asia are Immigrants from Thailand (56.6%, a difference of 0.020%), Ute (56.6%, a difference of 0.020%), Estonian (56.6%, a difference of 0.050%), Yugoslavian (56.6%, a difference of 0.060%), and Bulgarian (56.5%, a difference of 0.080%).
| Demographics | Rating | Rank | 2 or more Vehicles in Household |
| Sioux | 93.8 /100 | #121 | Exceptional 56.8% |
| Immigrants | South Africa | 92.5 /100 | #122 | Exceptional 56.7% |
| Australians | 91.8 /100 | #123 | Exceptional 56.7% |
| New Zealanders | 91.8 /100 | #124 | Exceptional 56.7% |
| Tsimshian | 91.6 /100 | #125 | Exceptional 56.7% |
| Estonians | 90.9 /100 | #126 | Exceptional 56.6% |
| Immigrants | Thailand | 90.7 /100 | #127 | Exceptional 56.6% |
| Immigrants | South Central Asia | 90.5 /100 | #128 | Exceptional 56.6% |
| Ute | 90.4 /100 | #129 | Exceptional 56.6% |
| Yugoslavians | 90.0 /100 | #130 | Exceptional 56.6% |
| Bulgarians | 89.7 /100 | #131 | Excellent 56.5% |
| Hungarians | 89.1 /100 | #132 | Excellent 56.5% |
| Comanche | 88.4 /100 | #133 | Excellent 56.5% |
| Immigrants | Azores | 86.6 /100 | #134 | Excellent 56.4% |
| Blackfeet | 86.5 /100 | #135 | Excellent 56.4% |
| Immigrants | Asia | 86.0 /100 | #136 | Excellent 56.3% |
| Cubans | 84.8 /100 | #137 | Excellent 56.3% |
| Salvadorans | 84.7 /100 | #138 | Excellent 56.3% |
| Armenians | 84.3 /100 | #139 | Excellent 56.3% |
| Latvians | 83.6 /100 | #140 | Excellent 56.2% |
| Immigrants | Cambodia | 83.6 /100 | #141 | Excellent 56.2% |