Immigrants from Asia vs Immigrants from England 3 or more Vehicles in Household
COMPARE
Immigrants from Asia
Immigrants from England
3 or more Vehicles in Household
3 or more Vehicles in Household Comparison
Immigrants from Asia
Immigrants from England
20.2%
3 OR MORE VEHICLES IN HOUSEHOLD
88.1/ 100
METRIC RATING
131st/ 347
METRIC RANK
20.7%
3 OR MORE VEHICLES IN HOUSEHOLD
96.2/ 100
METRIC RATING
113th/ 347
METRIC RANK
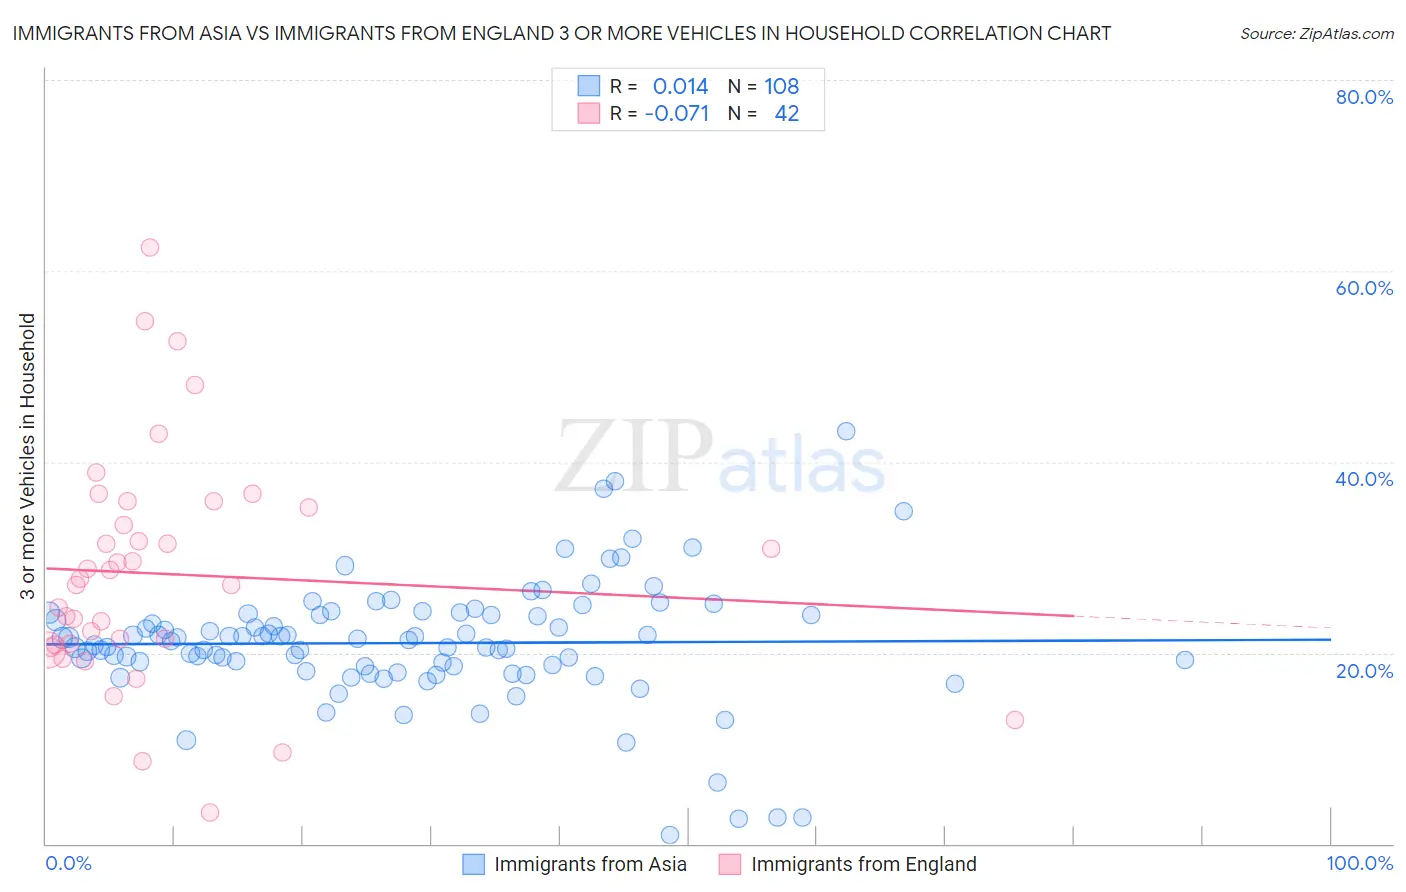
Immigrants from Asia vs Immigrants from England 3 or more Vehicles in Household Correlation Chart
The statistical analysis conducted on geographies consisting of 548,260,501 people shows no correlation between the proportion of Immigrants from Asia and percentage of households with 3 or more vehicles available in the United States with a correlation coefficient (R) of 0.014 and weighted average of 20.2%. Similarly, the statistical analysis conducted on geographies consisting of 391,649,997 people shows a slight negative correlation between the proportion of Immigrants from England and percentage of households with 3 or more vehicles available in the United States with a correlation coefficient (R) of -0.071 and weighted average of 20.7%, a difference of 2.2%.
3 or more Vehicles in Household Correlation Summary
| Measurement | Immigrants from Asia | Immigrants from England |
| Minimum | 0.88% | 3.3% |
| Maximum | 43.1% | 62.4% |
| Range | 42.3% | 59.1% |
| Mean | 21.0% | 28.2% |
| Median | 21.3% | 27.4% |
| Interquartile 25% (IQ1) | 18.6% | 20.8% |
| Interquartile 75% (IQ3) | 24.0% | 35.2% |
| Interquartile Range (IQR) | 5.4% | 14.4% |
| Standard Deviation (Sample) | 6.5% | 12.1% |
| Standard Deviation (Population) | 6.4% | 12.0% |
Demographics Similar to Immigrants from Asia and Immigrants from England by 3 or more Vehicles in Household
In terms of 3 or more vehicles in household, the demographic groups most similar to Immigrants from Asia are Immigrants from Canada (20.2%, a difference of 0.050%), Greek (20.3%, a difference of 0.070%), Zimbabwean (20.3%, a difference of 0.10%), New Zealander (20.4%, a difference of 0.62%), and Immigrants from Bolivia (20.4%, a difference of 0.79%). Similarly, the demographic groups most similar to Immigrants from England are Nicaraguan (20.7%, a difference of 0.010%), Burmese (20.6%, a difference of 0.18%), French Canadian (20.6%, a difference of 0.49%), Italian (20.6%, a difference of 0.52%), and Croatian (20.6%, a difference of 0.54%).
| Demographics | Rating | Rank | 3 or more Vehicles in Household |
| Nicaraguans | 96.2 /100 | #112 | Exceptional 20.7% |
| Immigrants | England | 96.2 /100 | #113 | Exceptional 20.7% |
| Burmese | 95.8 /100 | #114 | Exceptional 20.6% |
| French Canadians | 95.0 /100 | #115 | Exceptional 20.6% |
| Italians | 94.9 /100 | #116 | Exceptional 20.6% |
| Croatians | 94.9 /100 | #117 | Exceptional 20.6% |
| Costa Ricans | 94.6 /100 | #118 | Exceptional 20.6% |
| Immigrants | Latin America | 94.5 /100 | #119 | Exceptional 20.5% |
| Maltese | 93.9 /100 | #120 | Exceptional 20.5% |
| Immigrants | Thailand | 93.8 /100 | #121 | Exceptional 20.5% |
| German Russians | 93.7 /100 | #122 | Exceptional 20.5% |
| Immigrants | Korea | 93.7 /100 | #123 | Exceptional 20.5% |
| Central Americans | 93.1 /100 | #124 | Exceptional 20.5% |
| Immigrants | Netherlands | 92.9 /100 | #125 | Exceptional 20.4% |
| Slavs | 92.1 /100 | #126 | Exceptional 20.4% |
| Immigrants | Bolivia | 92.0 /100 | #127 | Exceptional 20.4% |
| New Zealanders | 91.3 /100 | #128 | Exceptional 20.4% |
| Zimbabweans | 88.7 /100 | #129 | Excellent 20.3% |
| Greeks | 88.6 /100 | #130 | Excellent 20.3% |
| Immigrants | Asia | 88.1 /100 | #131 | Excellent 20.2% |
| Immigrants | Canada | 87.8 /100 | #132 | Excellent 20.2% |