Icelander vs Immigrants from Lebanon No Vehicles in Household
COMPARE
Icelander
Immigrants from Lebanon
No Vehicles in Household
No Vehicles in Household Comparison
Icelanders
Immigrants from Lebanon
9.6%
NO VEHICLES IN HOUSEHOLD
90.2/ 100
METRIC RATING
126th/ 347
METRIC RANK
8.4%
NO VEHICLES IN HOUSEHOLD
99.6/ 100
METRIC RATING
71st/ 347
METRIC RANK
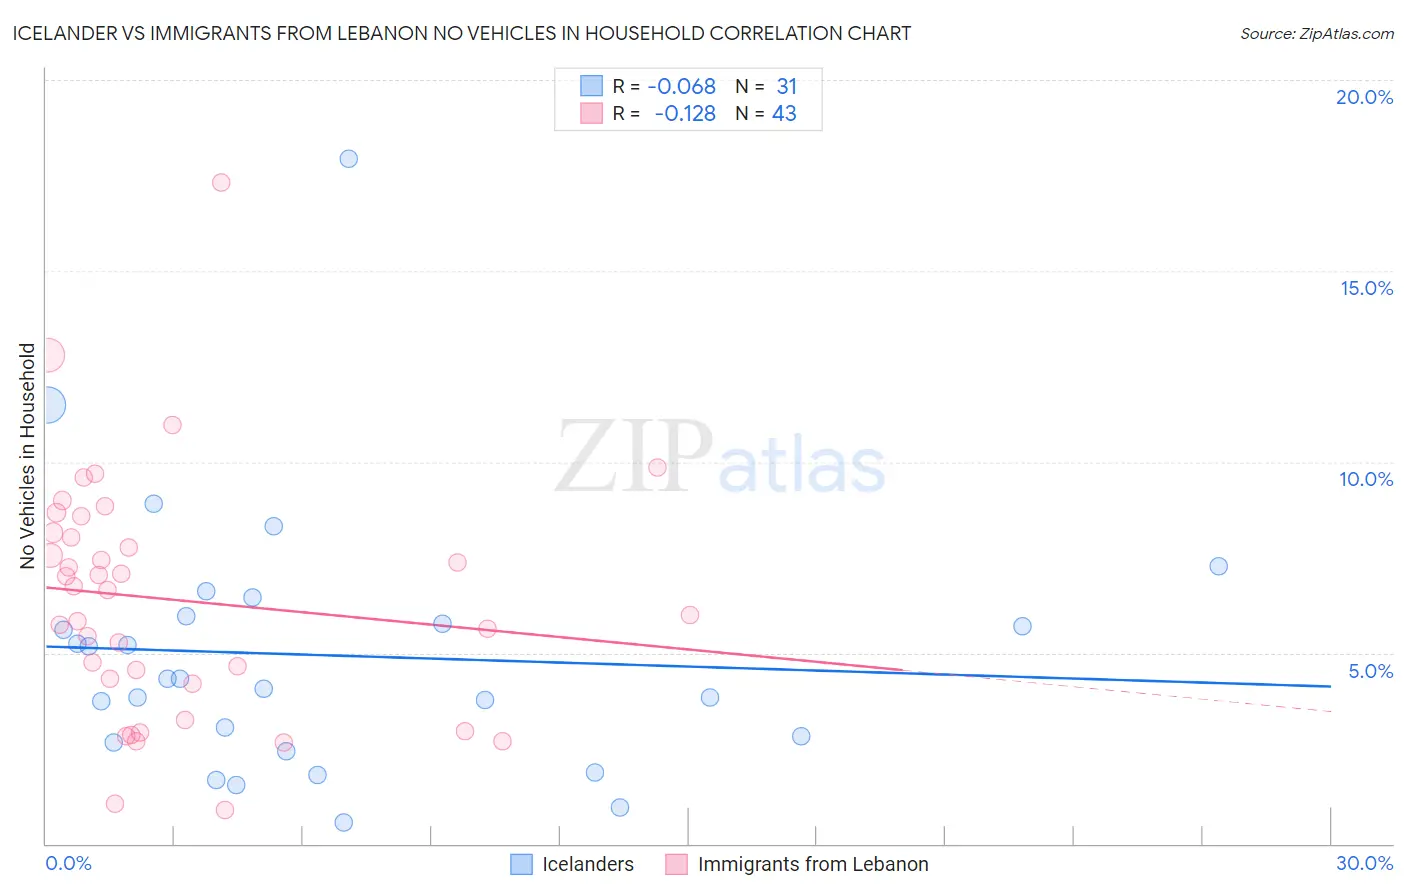
Icelander vs Immigrants from Lebanon No Vehicles in Household Correlation Chart
The statistical analysis conducted on geographies consisting of 159,468,771 people shows a slight negative correlation between the proportion of Icelanders and percentage of households with no vehicle available in the United States with a correlation coefficient (R) of -0.068 and weighted average of 9.6%. Similarly, the statistical analysis conducted on geographies consisting of 216,871,197 people shows a poor negative correlation between the proportion of Immigrants from Lebanon and percentage of households with no vehicle available in the United States with a correlation coefficient (R) of -0.128 and weighted average of 8.4%, a difference of 14.1%.
No Vehicles in Household Correlation Summary
| Measurement | Icelander | Immigrants from Lebanon |
| Minimum | 0.55% | 0.89% |
| Maximum | 17.9% | 17.3% |
| Range | 17.4% | 16.4% |
| Mean | 4.9% | 6.4% |
| Median | 4.3% | 6.7% |
| Interquartile 25% (IQ1) | 2.7% | 4.2% |
| Interquartile 75% (IQ3) | 6.0% | 8.2% |
| Interquartile Range (IQR) | 3.3% | 3.9% |
| Standard Deviation (Sample) | 3.4% | 3.2% |
| Standard Deviation (Population) | 3.4% | 3.2% |
Similar Demographics by No Vehicles in Household
Demographics Similar to Icelanders by No Vehicles in Household
In terms of no vehicles in household, the demographic groups most similar to Icelanders are Immigrants from Cameroon (9.6%, a difference of 0.17%), Immigrants from Kenya (9.6%, a difference of 0.18%), Immigrants from Syria (9.6%, a difference of 0.27%), Nicaraguan (9.7%, a difference of 0.29%), and Immigrants from Korea (9.6%, a difference of 0.30%).
| Demographics | Rating | Rank | No Vehicles in Household |
| Fijians | 92.7 /100 | #119 | Exceptional 9.5% |
| Immigrants | Thailand | 92.6 /100 | #120 | Exceptional 9.5% |
| Puget Sound Salish | 92.4 /100 | #121 | Exceptional 9.5% |
| Costa Ricans | 92.3 /100 | #122 | Exceptional 9.5% |
| Blackfeet | 91.4 /100 | #123 | Exceptional 9.6% |
| Immigrants | Korea | 90.9 /100 | #124 | Exceptional 9.6% |
| Immigrants | Cameroon | 90.6 /100 | #125 | Exceptional 9.6% |
| Icelanders | 90.2 /100 | #126 | Exceptional 9.6% |
| Immigrants | Kenya | 89.7 /100 | #127 | Excellent 9.6% |
| Immigrants | Syria | 89.5 /100 | #128 | Excellent 9.6% |
| Nicaraguans | 89.5 /100 | #129 | Excellent 9.7% |
| Burmese | 88.8 /100 | #130 | Excellent 9.7% |
| Immigrants | Azores | 88.2 /100 | #131 | Excellent 9.7% |
| Kenyans | 88.0 /100 | #132 | Excellent 9.7% |
| Immigrants | Oceania | 87.1 /100 | #133 | Excellent 9.7% |
Demographics Similar to Immigrants from Lebanon by No Vehicles in Household
In terms of no vehicles in household, the demographic groups most similar to Immigrants from Lebanon are Cajun (8.4%, a difference of 0.030%), Lithuanian (8.4%, a difference of 0.030%), Polish (8.4%, a difference of 0.060%), Spaniard (8.4%, a difference of 0.75%), and Immigrants from Iran (8.4%, a difference of 0.81%).
| Demographics | Rating | Rank | No Vehicles in Household |
| Croatians | 99.8 /100 | #64 | Exceptional 8.3% |
| Canadians | 99.7 /100 | #65 | Exceptional 8.3% |
| Palestinians | 99.7 /100 | #66 | Exceptional 8.3% |
| Immigrants | Scotland | 99.7 /100 | #67 | Exceptional 8.3% |
| Immigrants | Iran | 99.7 /100 | #68 | Exceptional 8.4% |
| Spaniards | 99.7 /100 | #69 | Exceptional 8.4% |
| Cajuns | 99.6 /100 | #70 | Exceptional 8.4% |
| Immigrants | Lebanon | 99.6 /100 | #71 | Exceptional 8.4% |
| Lithuanians | 99.6 /100 | #72 | Exceptional 8.4% |
| Poles | 99.6 /100 | #73 | Exceptional 8.4% |
| Cubans | 99.5 /100 | #74 | Exceptional 8.5% |
| Jordanians | 99.5 /100 | #75 | Exceptional 8.5% |
| Immigrants | Philippines | 99.5 /100 | #76 | Exceptional 8.5% |
| Iranians | 99.5 /100 | #77 | Exceptional 8.6% |
| Immigrants | South Central Asia | 99.5 /100 | #78 | Exceptional 8.6% |