Hispanic or Latino vs Korean 2 or more Vehicles in Household
COMPARE
Hispanic or Latino
Korean
2 or more Vehicles in Household
2 or more Vehicles in Household Comparison
Hispanics or Latinos
Koreans
57.9%
2 OR MORE VEHICLES IN HOUSEHOLD
99.0/ 100
METRIC RATING
90th/ 347
METRIC RANK
61.0%
2 OR MORE VEHICLES IN HOUSEHOLD
100.0/ 100
METRIC RATING
21st/ 347
METRIC RANK
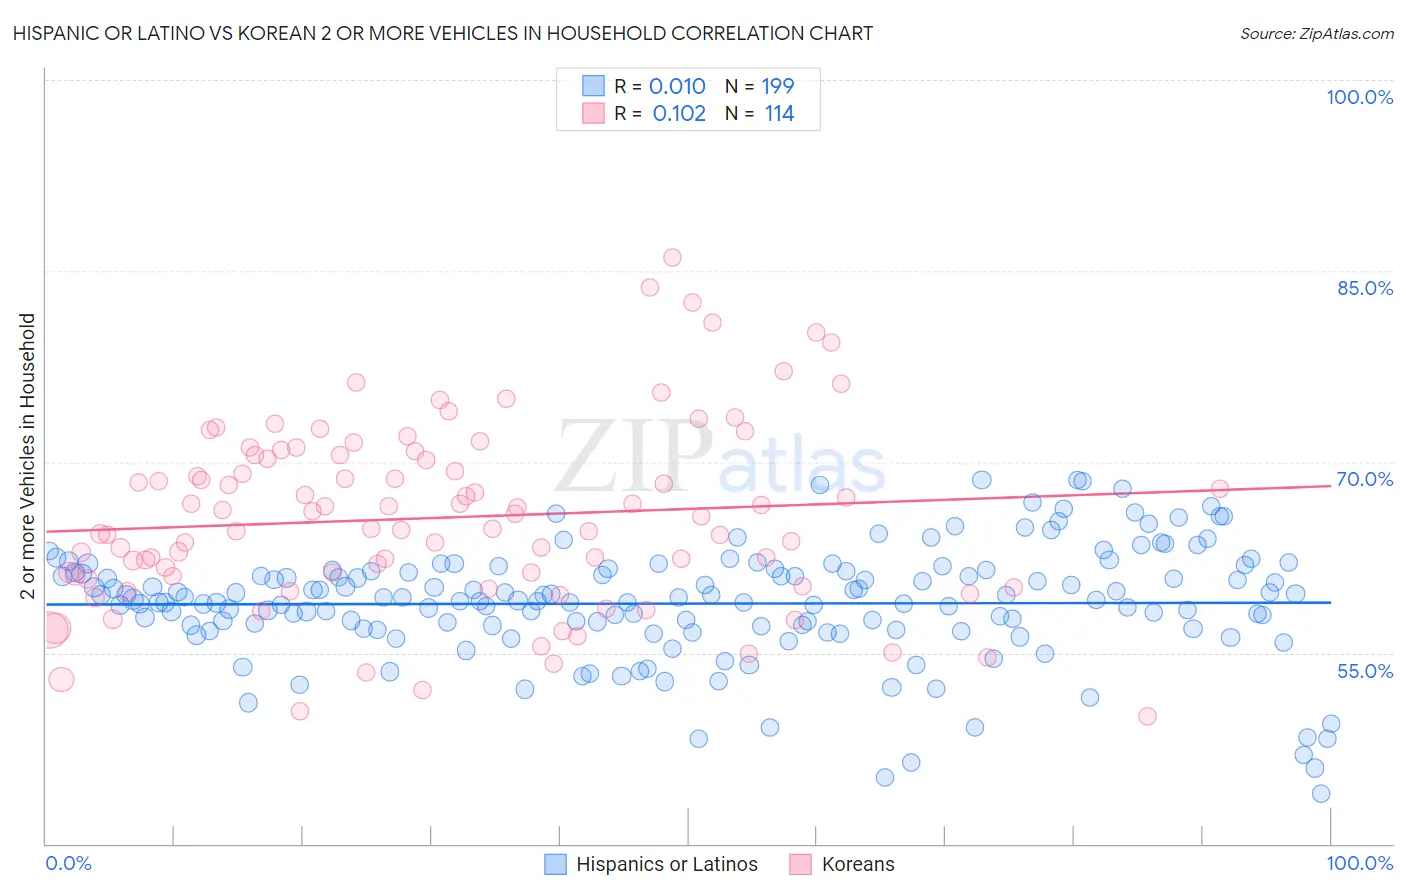
Hispanic or Latino vs Korean 2 or more Vehicles in Household Correlation Chart
The statistical analysis conducted on geographies consisting of 560,775,190 people shows no correlation between the proportion of Hispanics or Latinos and percentage of households with 2 or more vehicles available in the United States with a correlation coefficient (R) of 0.010 and weighted average of 57.9%. Similarly, the statistical analysis conducted on geographies consisting of 510,458,267 people shows a poor positive correlation between the proportion of Koreans and percentage of households with 2 or more vehicles available in the United States with a correlation coefficient (R) of 0.102 and weighted average of 61.0%, a difference of 5.3%.
2 or more Vehicles in Household Correlation Summary
| Measurement | Hispanic or Latino | Korean |
| Minimum | 44.0% | 50.0% |
| Maximum | 68.6% | 86.1% |
| Range | 24.6% | 36.1% |
| Mean | 58.9% | 65.6% |
| Median | 59.1% | 65.3% |
| Interquartile 25% (IQ1) | 56.9% | 61.0% |
| Interquartile 75% (IQ3) | 61.4% | 70.5% |
| Interquartile Range (IQR) | 4.5% | 9.5% |
| Standard Deviation (Sample) | 4.5% | 7.2% |
| Standard Deviation (Population) | 4.5% | 7.2% |
Similar Demographics by 2 or more Vehicles in Household
Demographics Similar to Hispanics or Latinos by 2 or more Vehicles in Household
In terms of 2 or more vehicles in household, the demographic groups most similar to Hispanics or Latinos are Immigrants from Germany (57.9%, a difference of 0.0%), Pakistani (57.9%, a difference of 0.030%), Shoshone (57.9%, a difference of 0.050%), Ottawa (57.9%, a difference of 0.060%), and Immigrants from Iran (57.9%, a difference of 0.070%).
| Demographics | Rating | Rank | 2 or more Vehicles in Household |
| Icelanders | 99.2 /100 | #83 | Exceptional 58.0% |
| Maltese | 99.2 /100 | #84 | Exceptional 58.0% |
| Slovaks | 99.2 /100 | #85 | Exceptional 58.0% |
| Potawatomi | 99.1 /100 | #86 | Exceptional 58.0% |
| Thais | 99.1 /100 | #87 | Exceptional 57.9% |
| Immigrants | Iran | 99.1 /100 | #88 | Exceptional 57.9% |
| Immigrants | Germany | 99.0 /100 | #89 | Exceptional 57.9% |
| Hispanics or Latinos | 99.0 /100 | #90 | Exceptional 57.9% |
| Pakistanis | 99.0 /100 | #91 | Exceptional 57.9% |
| Shoshone | 99.0 /100 | #92 | Exceptional 57.9% |
| Ottawa | 99.0 /100 | #93 | Exceptional 57.9% |
| Filipinos | 98.9 /100 | #94 | Exceptional 57.8% |
| Hmong | 98.9 /100 | #95 | Exceptional 57.8% |
| Burmese | 98.8 /100 | #96 | Exceptional 57.8% |
| Slavs | 98.8 /100 | #97 | Exceptional 57.8% |
Demographics Similar to Koreans by 2 or more Vehicles in Household
In terms of 2 or more vehicles in household, the demographic groups most similar to Koreans are Sri Lankan (61.0%, a difference of 0.040%), Swiss (61.0%, a difference of 0.040%), Scotch-Irish (60.9%, a difference of 0.070%), Immigrants from Vietnam (60.9%, a difference of 0.11%), and White/Caucasian (60.8%, a difference of 0.26%).
| Demographics | Rating | Rank | 2 or more Vehicles in Household |
| Czechs | 100.0 /100 | #14 | Exceptional 61.5% |
| Nepalese | 100.0 /100 | #15 | Exceptional 61.4% |
| Native Hawaiians | 100.0 /100 | #16 | Exceptional 61.4% |
| Basques | 100.0 /100 | #17 | Exceptional 61.4% |
| Europeans | 100.0 /100 | #18 | Exceptional 61.4% |
| Scottish | 100.0 /100 | #19 | Exceptional 61.2% |
| Sri Lankans | 100.0 /100 | #20 | Exceptional 61.0% |
| Koreans | 100.0 /100 | #21 | Exceptional 61.0% |
| Swiss | 100.0 /100 | #22 | Exceptional 61.0% |
| Scotch-Irish | 100.0 /100 | #23 | Exceptional 60.9% |
| Immigrants | Vietnam | 100.0 /100 | #24 | Exceptional 60.9% |
| Whites/Caucasians | 100.0 /100 | #25 | Exceptional 60.8% |
| Welsh | 100.0 /100 | #26 | Exceptional 60.8% |
| Assyrians/Chaldeans/Syriacs | 100.0 /100 | #27 | Exceptional 60.5% |
| Guamanians/Chamorros | 100.0 /100 | #28 | Exceptional 60.5% |