Greek vs South American Indian 2 or more Vehicles in Household
COMPARE
Greek
South American Indian
2 or more Vehicles in Household
2 or more Vehicles in Household Comparison
Greeks
South American Indians
57.5%
2 OR MORE VEHICLES IN HOUSEHOLD
98.0/ 100
METRIC RATING
111th/ 347
METRIC RANK
53.9%
2 OR MORE VEHICLES IN HOUSEHOLD
6.5/ 100
METRIC RATING
219th/ 347
METRIC RANK
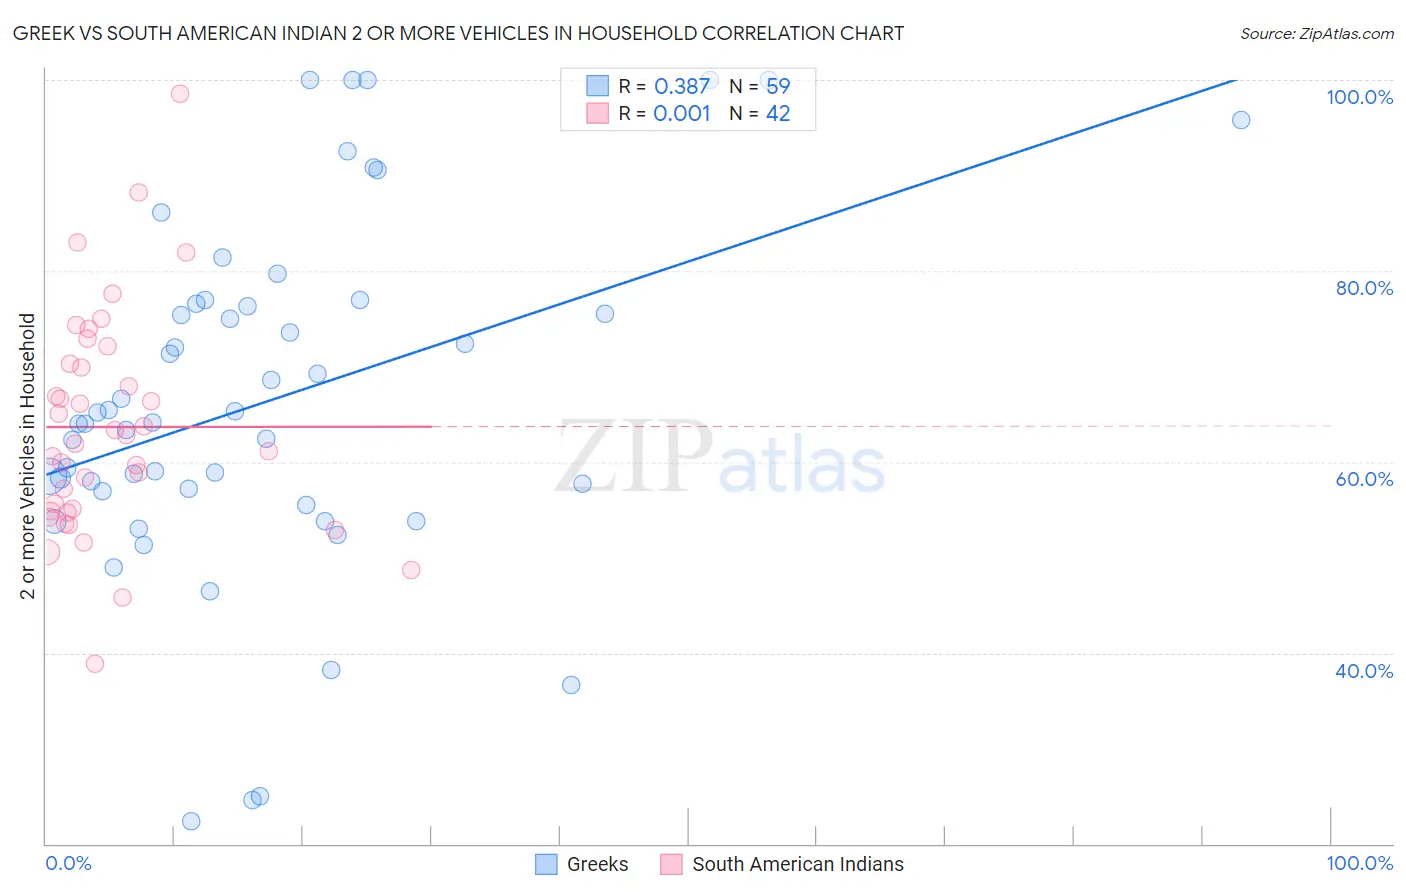
Greek vs South American Indian 2 or more Vehicles in Household Correlation Chart
The statistical analysis conducted on geographies consisting of 482,397,984 people shows a mild positive correlation between the proportion of Greeks and percentage of households with 2 or more vehicles available in the United States with a correlation coefficient (R) of 0.387 and weighted average of 57.5%. Similarly, the statistical analysis conducted on geographies consisting of 164,540,449 people shows no correlation between the proportion of South American Indians and percentage of households with 2 or more vehicles available in the United States with a correlation coefficient (R) of 0.001 and weighted average of 53.9%, a difference of 6.7%.
2 or more Vehicles in Household Correlation Summary
| Measurement | Greek | South American Indian |
| Minimum | 22.4% | 38.9% |
| Maximum | 100.0% | 98.5% |
| Range | 77.6% | 59.6% |
| Mean | 66.4% | 63.7% |
| Median | 64.1% | 62.4% |
| Interquartile 25% (IQ1) | 56.9% | 54.8% |
| Interquartile 75% (IQ3) | 76.6% | 70.2% |
| Interquartile Range (IQR) | 19.7% | 15.4% |
| Standard Deviation (Sample) | 18.4% | 11.8% |
| Standard Deviation (Population) | 18.3% | 11.6% |
Similar Demographics by 2 or more Vehicles in Household
Demographics Similar to Greeks by 2 or more Vehicles in Household
In terms of 2 or more vehicles in household, the demographic groups most similar to Greeks are Pueblo (57.5%, a difference of 0.0%), Japanese (57.5%, a difference of 0.030%), Immigrants from North America (57.5%, a difference of 0.050%), Immigrants from Canada (57.5%, a difference of 0.080%), and Immigrants from Netherlands (57.5%, a difference of 0.10%).
| Demographics | Rating | Rank | 2 or more Vehicles in Household |
| Immigrants | Indonesia | 98.2 /100 | #104 | Exceptional 57.6% |
| Immigrants | Korea | 98.2 /100 | #105 | Exceptional 57.6% |
| Immigrants | Oceania | 98.2 /100 | #106 | Exceptional 57.5% |
| Immigrants | Netherlands | 98.2 /100 | #107 | Exceptional 57.5% |
| Immigrants | Canada | 98.1 /100 | #108 | Exceptional 57.5% |
| Immigrants | North America | 98.1 /100 | #109 | Exceptional 57.5% |
| Japanese | 98.0 /100 | #110 | Exceptional 57.5% |
| Greeks | 98.0 /100 | #111 | Exceptional 57.5% |
| Pueblo | 98.0 /100 | #112 | Exceptional 57.5% |
| Zimbabweans | 96.9 /100 | #113 | Exceptional 57.2% |
| Immigrants | Lebanon | 96.8 /100 | #114 | Exceptional 57.2% |
| Chippewa | 96.6 /100 | #115 | Exceptional 57.2% |
| Immigrants | Jordan | 96.6 /100 | #116 | Exceptional 57.2% |
| Iraqis | 95.8 /100 | #117 | Exceptional 57.1% |
| Asians | 95.1 /100 | #118 | Exceptional 57.0% |
Demographics Similar to South American Indians by 2 or more Vehicles in Household
In terms of 2 or more vehicles in household, the demographic groups most similar to South American Indians are Taiwanese (53.9%, a difference of 0.020%), Immigrants from Singapore (53.9%, a difference of 0.040%), Kiowa (53.9%, a difference of 0.050%), Immigrants from Argentina (53.9%, a difference of 0.060%), and Immigrants from Burma/Myanmar (53.9%, a difference of 0.11%).
| Demographics | Rating | Rank | 2 or more Vehicles in Household |
| Immigrants | Chile | 11.1 /100 | #212 | Poor 54.2% |
| Guatemalans | 9.6 /100 | #213 | Tragic 54.1% |
| Immigrants | Czechoslovakia | 9.4 /100 | #214 | Tragic 54.1% |
| Aleuts | 9.3 /100 | #215 | Tragic 54.1% |
| Immigrants | Western Asia | 9.3 /100 | #216 | Tragic 54.1% |
| Immigrants | Burma/Myanmar | 7.1 /100 | #217 | Tragic 53.9% |
| Immigrants | Argentina | 6.8 /100 | #218 | Tragic 53.9% |
| South American Indians | 6.5 /100 | #219 | Tragic 53.9% |
| Taiwanese | 6.3 /100 | #220 | Tragic 53.9% |
| Immigrants | Singapore | 6.3 /100 | #221 | Tragic 53.9% |
| Kiowa | 6.2 /100 | #222 | Tragic 53.9% |
| Immigrants | Bosnia and Herzegovina | 5.5 /100 | #223 | Tragic 53.8% |
| Brazilians | 5.3 /100 | #224 | Tragic 53.8% |
| Immigrants | Egypt | 5.2 /100 | #225 | Tragic 53.8% |
| Immigrants | Eastern Africa | 5.1 /100 | #226 | Tragic 53.7% |