German Russian vs Peruvian 2 or more Vehicles in Household
COMPARE
German Russian
Peruvian
2 or more Vehicles in Household
2 or more Vehicles in Household Comparison
German Russians
Peruvians
55.6%
2 OR MORE VEHICLES IN HOUSEHOLD
60.9/ 100
METRIC RATING
162nd/ 347
METRIC RANK
55.0%
2 OR MORE VEHICLES IN HOUSEHOLD
33.7/ 100
METRIC RATING
186th/ 347
METRIC RANK
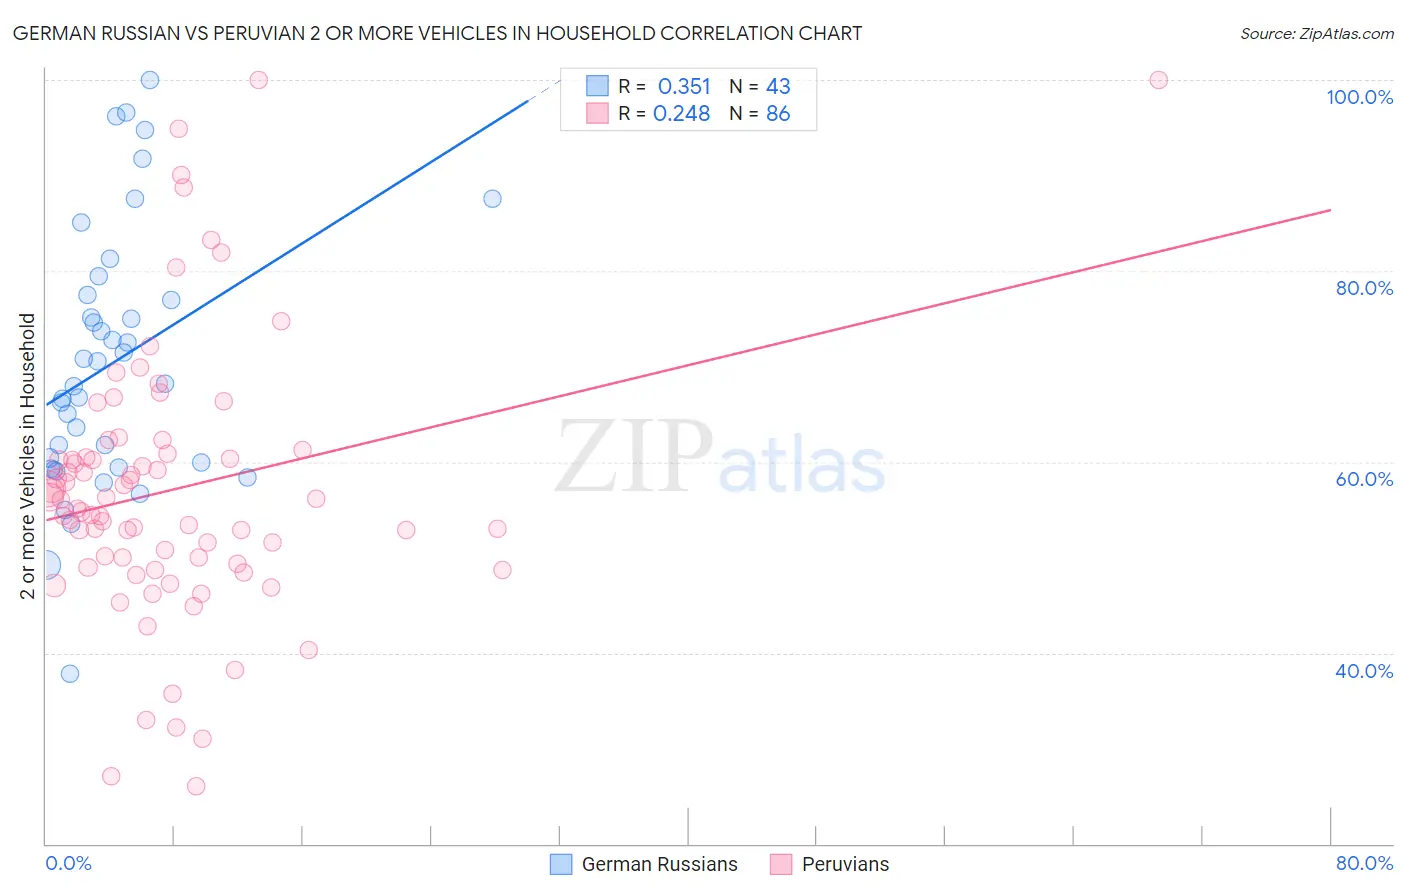
German Russian vs Peruvian 2 or more Vehicles in Household Correlation Chart
The statistical analysis conducted on geographies consisting of 96,451,375 people shows a mild positive correlation between the proportion of German Russians and percentage of households with 2 or more vehicles available in the United States with a correlation coefficient (R) of 0.351 and weighted average of 55.6%. Similarly, the statistical analysis conducted on geographies consisting of 363,025,194 people shows a weak positive correlation between the proportion of Peruvians and percentage of households with 2 or more vehicles available in the United States with a correlation coefficient (R) of 0.248 and weighted average of 55.0%, a difference of 1.1%.
2 or more Vehicles in Household Correlation Summary
| Measurement | German Russian | Peruvian |
| Minimum | 37.7% | 26.0% |
| Maximum | 100.0% | 100.0% |
| Range | 62.3% | 74.0% |
| Mean | 70.3% | 57.1% |
| Median | 68.2% | 55.6% |
| Interquartile 25% (IQ1) | 59.5% | 49.4% |
| Interquartile 75% (IQ3) | 77.5% | 60.9% |
| Interquartile Range (IQR) | 18.0% | 11.5% |
| Standard Deviation (Sample) | 13.8% | 14.3% |
| Standard Deviation (Population) | 13.6% | 14.2% |
Similar Demographics by 2 or more Vehicles in Household
Demographics Similar to German Russians by 2 or more Vehicles in Household
In terms of 2 or more vehicles in household, the demographic groups most similar to German Russians are Colville (55.6%, a difference of 0.010%), Immigrants from Zimbabwe (55.6%, a difference of 0.030%), Dutch West Indian (55.6%, a difference of 0.040%), Immigrants from El Salvador (55.6%, a difference of 0.060%), and Immigrants from Sri Lanka (55.5%, a difference of 0.10%).
| Demographics | Rating | Rank | 2 or more Vehicles in Household |
| Immigrants | Venezuela | 70.7 /100 | #155 | Good 55.8% |
| Immigrants | Lithuania | 70.4 /100 | #156 | Good 55.8% |
| Immigrants | Kuwait | 70.2 /100 | #157 | Good 55.8% |
| Tlingit-Haida | 68.5 /100 | #158 | Good 55.8% |
| Paiute | 68.0 /100 | #159 | Good 55.8% |
| Crow | 67.0 /100 | #160 | Good 55.7% |
| Colville | 61.1 /100 | #161 | Good 55.6% |
| German Russians | 60.9 /100 | #162 | Good 55.6% |
| Immigrants | Zimbabwe | 60.2 /100 | #163 | Good 55.6% |
| Dutch West Indians | 59.8 /100 | #164 | Average 55.6% |
| Immigrants | El Salvador | 59.4 /100 | #165 | Average 55.6% |
| Immigrants | Sri Lanka | 58.3 /100 | #166 | Average 55.5% |
| Kenyans | 58.1 /100 | #167 | Average 55.5% |
| French American Indians | 56.7 /100 | #168 | Average 55.5% |
| Immigrants | Austria | 56.3 /100 | #169 | Average 55.5% |
Demographics Similar to Peruvians by 2 or more Vehicles in Household
In terms of 2 or more vehicles in household, the demographic groups most similar to Peruvians are Immigrants from Uganda (55.0%, a difference of 0.010%), Arab (55.0%, a difference of 0.10%), Apache (55.1%, a difference of 0.13%), Marshallese (54.9%, a difference of 0.15%), and Immigrants from Cameroon (55.1%, a difference of 0.16%).
| Demographics | Rating | Rank | 2 or more Vehicles in Household |
| Alaskan Athabascans | 42.9 /100 | #179 | Average 55.2% |
| Immigrants | Kenya | 40.4 /100 | #180 | Average 55.1% |
| Immigrants | Micronesia | 38.2 /100 | #181 | Fair 55.1% |
| Cree | 38.2 /100 | #182 | Fair 55.1% |
| Immigrants | Cameroon | 37.3 /100 | #183 | Fair 55.1% |
| Apache | 36.7 /100 | #184 | Fair 55.1% |
| Arabs | 35.9 /100 | #185 | Fair 55.0% |
| Peruvians | 33.7 /100 | #186 | Fair 55.0% |
| Immigrants | Uganda | 33.4 /100 | #187 | Fair 55.0% |
| Marshallese | 30.5 /100 | #188 | Fair 54.9% |
| Eastern Europeans | 27.5 /100 | #189 | Fair 54.8% |
| Russians | 26.3 /100 | #190 | Fair 54.8% |
| Immigrants | Immigrants | 25.0 /100 | #191 | Fair 54.7% |
| Immigrants | Romania | 23.8 /100 | #192 | Fair 54.7% |
| Immigrants | Japan | 23.4 /100 | #193 | Fair 54.7% |