Burmese vs Immigrants from Israel 3 or more Vehicles in Household
COMPARE
Burmese
Immigrants from Israel
3 or more Vehicles in Household
3 or more Vehicles in Household Comparison
Burmese
Immigrants from Israel
20.6%
3 OR MORE VEHICLES IN HOUSEHOLD
95.8/ 100
METRIC RATING
114th/ 347
METRIC RANK
15.6%
3 OR MORE VEHICLES IN HOUSEHOLD
0.0/ 100
METRIC RATING
313th/ 347
METRIC RANK
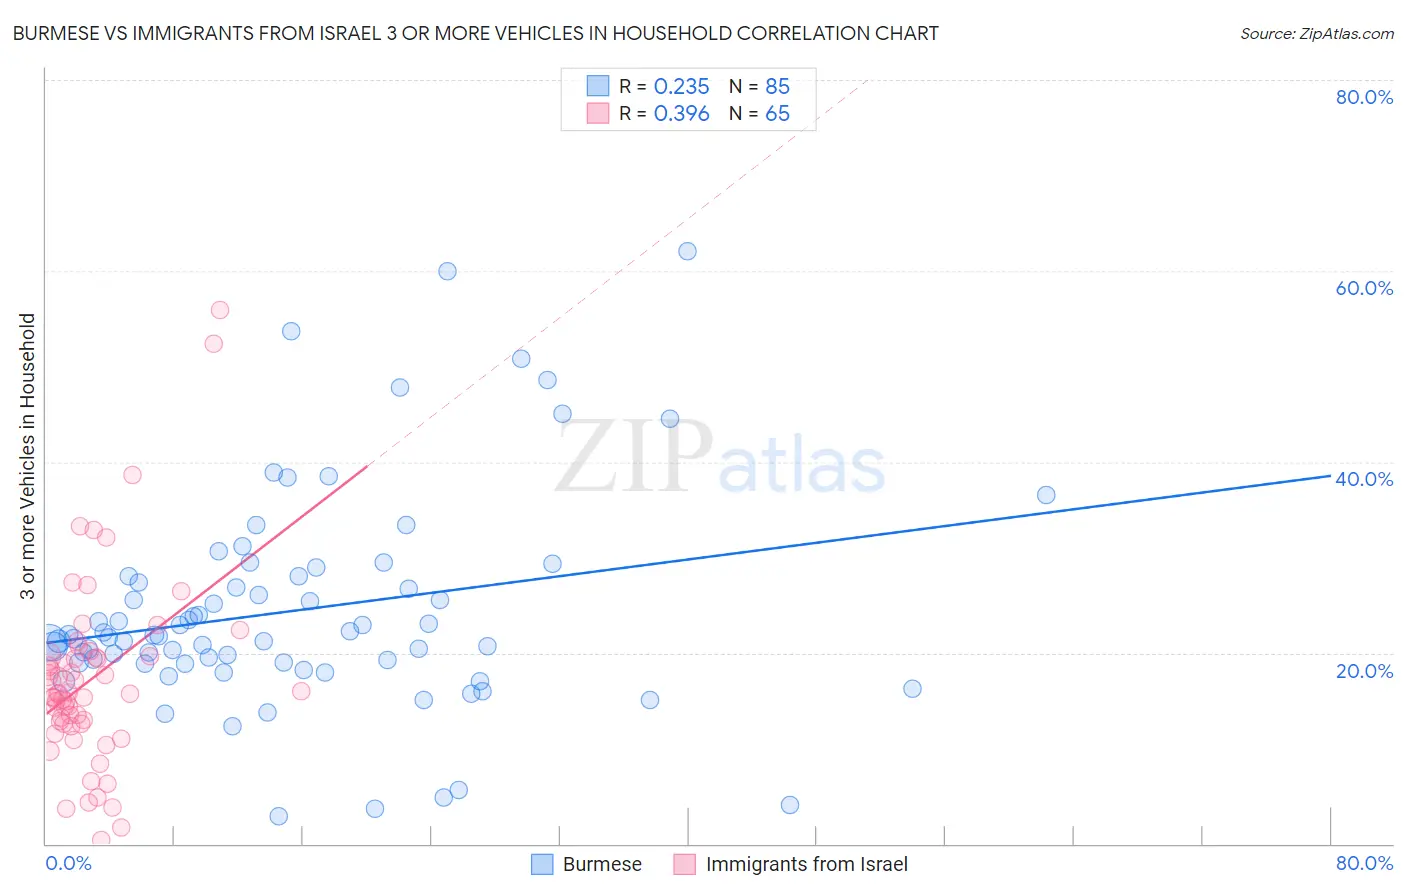
Burmese vs Immigrants from Israel 3 or more Vehicles in Household Correlation Chart
The statistical analysis conducted on geographies consisting of 464,700,639 people shows a weak positive correlation between the proportion of Burmese and percentage of households with 3 or more vehicles available in the United States with a correlation coefficient (R) of 0.235 and weighted average of 20.6%. Similarly, the statistical analysis conducted on geographies consisting of 209,931,156 people shows a mild positive correlation between the proportion of Immigrants from Israel and percentage of households with 3 or more vehicles available in the United States with a correlation coefficient (R) of 0.396 and weighted average of 15.6%, a difference of 32.2%.
3 or more Vehicles in Household Correlation Summary
| Measurement | Burmese | Immigrants from Israel |
| Minimum | 2.8% | 0.45% |
| Maximum | 62.0% | 55.9% |
| Range | 59.2% | 55.5% |
| Mean | 24.5% | 17.3% |
| Median | 21.7% | 15.7% |
| Interquartile 25% (IQ1) | 18.9% | 12.5% |
| Interquartile 75% (IQ3) | 28.0% | 19.6% |
| Interquartile Range (IQR) | 9.1% | 7.1% |
| Standard Deviation (Sample) | 11.4% | 9.9% |
| Standard Deviation (Population) | 11.3% | 9.9% |
Similar Demographics by 3 or more Vehicles in Household
Demographics Similar to Burmese by 3 or more Vehicles in Household
In terms of 3 or more vehicles in household, the demographic groups most similar to Burmese are Immigrants from England (20.7%, a difference of 0.18%), Nicaraguan (20.7%, a difference of 0.19%), French Canadian (20.6%, a difference of 0.31%), Italian (20.6%, a difference of 0.34%), and Croatian (20.6%, a difference of 0.36%).
| Demographics | Rating | Rank | 3 or more Vehicles in Household |
| Immigrants | Germany | 97.4 /100 | #107 | Exceptional 20.8% |
| Immigrants | Scotland | 97.1 /100 | #108 | Exceptional 20.8% |
| Filipinos | 97.0 /100 | #109 | Exceptional 20.8% |
| Asians | 96.8 /100 | #110 | Exceptional 20.8% |
| Immigrants | Micronesia | 96.7 /100 | #111 | Exceptional 20.7% |
| Nicaraguans | 96.2 /100 | #112 | Exceptional 20.7% |
| Immigrants | England | 96.2 /100 | #113 | Exceptional 20.7% |
| Burmese | 95.8 /100 | #114 | Exceptional 20.6% |
| French Canadians | 95.0 /100 | #115 | Exceptional 20.6% |
| Italians | 94.9 /100 | #116 | Exceptional 20.6% |
| Croatians | 94.9 /100 | #117 | Exceptional 20.6% |
| Costa Ricans | 94.6 /100 | #118 | Exceptional 20.6% |
| Immigrants | Latin America | 94.5 /100 | #119 | Exceptional 20.5% |
| Maltese | 93.9 /100 | #120 | Exceptional 20.5% |
| Immigrants | Thailand | 93.8 /100 | #121 | Exceptional 20.5% |
Demographics Similar to Immigrants from Israel by 3 or more Vehicles in Household
In terms of 3 or more vehicles in household, the demographic groups most similar to Immigrants from Israel are Puerto Rican (15.6%, a difference of 0.020%), Immigrants from Belarus (15.5%, a difference of 0.64%), Haitian (15.5%, a difference of 0.96%), Albanian (15.8%, a difference of 1.2%), and U.S. Virgin Islander (15.4%, a difference of 1.5%).
| Demographics | Rating | Rank | 3 or more Vehicles in Household |
| Somalis | 0.0 /100 | #306 | Tragic 16.2% |
| Immigrants | Ghana | 0.0 /100 | #307 | Tragic 16.2% |
| Houma | 0.0 /100 | #308 | Tragic 16.1% |
| Immigrants | Somalia | 0.0 /100 | #309 | Tragic 15.9% |
| Moroccans | 0.0 /100 | #310 | Tragic 15.9% |
| Albanians | 0.0 /100 | #311 | Tragic 15.8% |
| Puerto Ricans | 0.0 /100 | #312 | Tragic 15.6% |
| Immigrants | Israel | 0.0 /100 | #313 | Tragic 15.6% |
| Immigrants | Belarus | 0.0 /100 | #314 | Tragic 15.5% |
| Haitians | 0.0 /100 | #315 | Tragic 15.5% |
| U.S. Virgin Islanders | 0.0 /100 | #316 | Tragic 15.4% |
| Jamaicans | 0.0 /100 | #317 | Tragic 15.2% |
| Immigrants | Haiti | 0.0 /100 | #318 | Tragic 15.2% |
| Cape Verdeans | 0.0 /100 | #319 | Tragic 15.0% |
| Yup'ik | 0.0 /100 | #320 | Tragic 14.8% |