Bulgarian vs Macedonian 2 or more Vehicles in Household
COMPARE
Bulgarian
Macedonian
2 or more Vehicles in Household
2 or more Vehicles in Household Comparison
Bulgarians
Macedonians
56.5%
2 OR MORE VEHICLES IN HOUSEHOLD
89.7/ 100
METRIC RATING
131st/ 347
METRIC RANK
53.3%
2 OR MORE VEHICLES IN HOUSEHOLD
2.4/ 100
METRIC RATING
237th/ 347
METRIC RANK
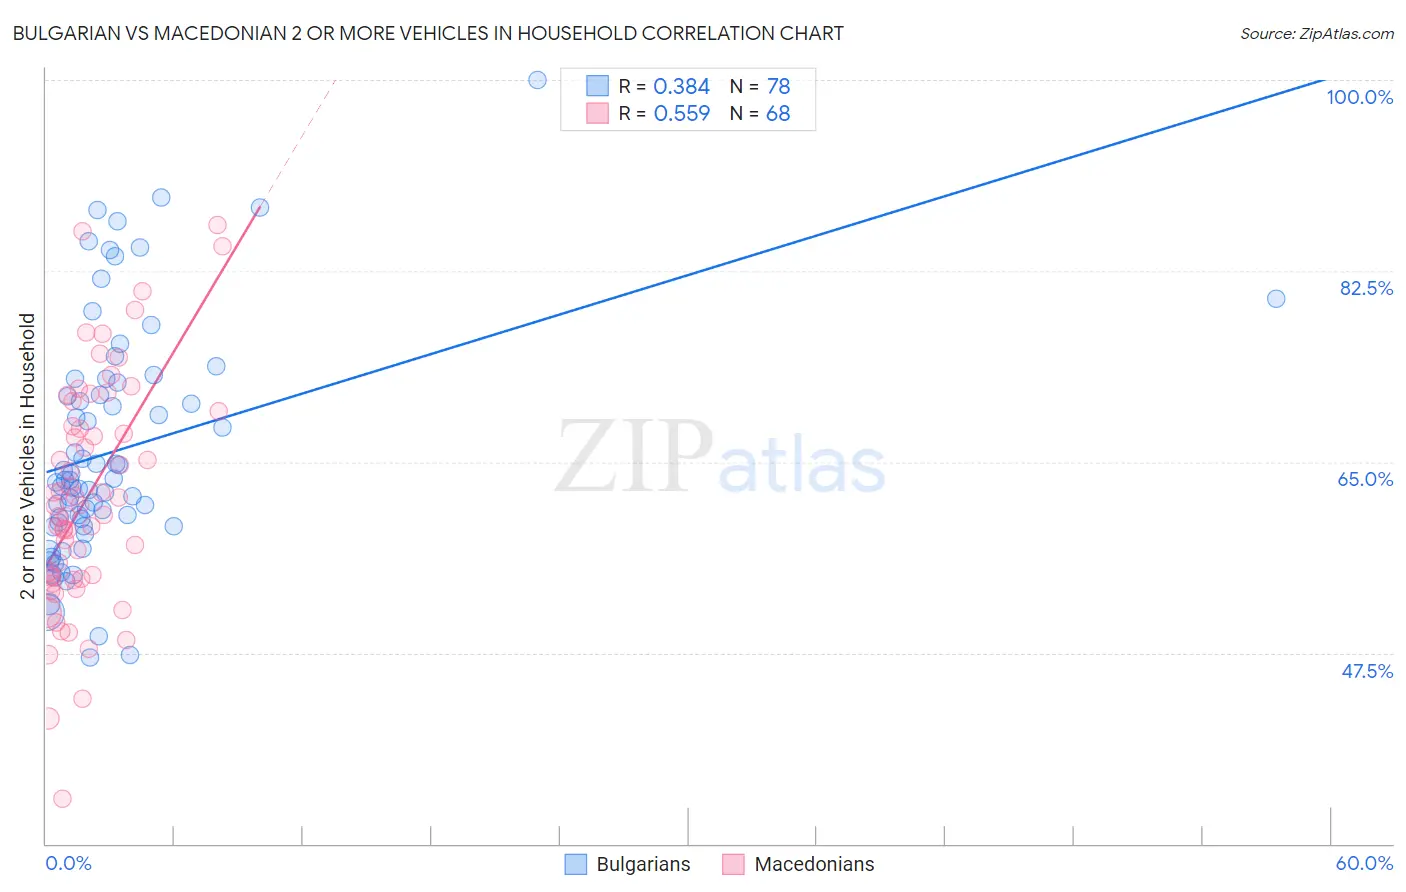
Bulgarian vs Macedonian 2 or more Vehicles in Household Correlation Chart
The statistical analysis conducted on geographies consisting of 205,573,622 people shows a mild positive correlation between the proportion of Bulgarians and percentage of households with 2 or more vehicles available in the United States with a correlation coefficient (R) of 0.384 and weighted average of 56.5%. Similarly, the statistical analysis conducted on geographies consisting of 132,543,746 people shows a substantial positive correlation between the proportion of Macedonians and percentage of households with 2 or more vehicles available in the United States with a correlation coefficient (R) of 0.559 and weighted average of 53.3%, a difference of 6.0%.
2 or more Vehicles in Household Correlation Summary
| Measurement | Bulgarian | Macedonian |
| Minimum | 47.1% | 34.1% |
| Maximum | 100.0% | 86.7% |
| Range | 52.9% | 52.6% |
| Mean | 66.1% | 61.9% |
| Median | 63.2% | 61.0% |
| Interquartile 25% (IQ1) | 59.1% | 54.4% |
| Interquartile 75% (IQ3) | 72.2% | 69.0% |
| Interquartile Range (IQR) | 13.1% | 14.5% |
| Standard Deviation (Sample) | 10.9% | 10.7% |
| Standard Deviation (Population) | 10.8% | 10.6% |
Similar Demographics by 2 or more Vehicles in Household
Demographics Similar to Bulgarians by 2 or more Vehicles in Household
In terms of 2 or more vehicles in household, the demographic groups most similar to Bulgarians are Yugoslavian (56.6%, a difference of 0.030%), Hungarian (56.5%, a difference of 0.060%), Ute (56.6%, a difference of 0.070%), Immigrants from South Central Asia (56.6%, a difference of 0.080%), and Immigrants from Thailand (56.6%, a difference of 0.10%).
| Demographics | Rating | Rank | 2 or more Vehicles in Household |
| New Zealanders | 91.8 /100 | #124 | Exceptional 56.7% |
| Tsimshian | 91.6 /100 | #125 | Exceptional 56.7% |
| Estonians | 90.9 /100 | #126 | Exceptional 56.6% |
| Immigrants | Thailand | 90.7 /100 | #127 | Exceptional 56.6% |
| Immigrants | South Central Asia | 90.5 /100 | #128 | Exceptional 56.6% |
| Ute | 90.4 /100 | #129 | Exceptional 56.6% |
| Yugoslavians | 90.0 /100 | #130 | Exceptional 56.6% |
| Bulgarians | 89.7 /100 | #131 | Excellent 56.5% |
| Hungarians | 89.1 /100 | #132 | Excellent 56.5% |
| Comanche | 88.4 /100 | #133 | Excellent 56.5% |
| Immigrants | Azores | 86.6 /100 | #134 | Excellent 56.4% |
| Blackfeet | 86.5 /100 | #135 | Excellent 56.4% |
| Immigrants | Asia | 86.0 /100 | #136 | Excellent 56.3% |
| Cubans | 84.8 /100 | #137 | Excellent 56.3% |
| Salvadorans | 84.7 /100 | #138 | Excellent 56.3% |
Demographics Similar to Macedonians by 2 or more Vehicles in Household
In terms of 2 or more vehicles in household, the demographic groups most similar to Macedonians are Immigrants from Armenia (53.3%, a difference of 0.070%), Cambodian (53.3%, a difference of 0.070%), Indonesian (53.4%, a difference of 0.11%), Immigrants from Europe (53.2%, a difference of 0.14%), and Immigrants from Sierra Leone (53.2%, a difference of 0.17%).
| Demographics | Rating | Rank | 2 or more Vehicles in Household |
| Immigrants | Nepal | 3.6 /100 | #230 | Tragic 53.5% |
| Panamanians | 3.4 /100 | #231 | Tragic 53.5% |
| Immigrants | Guatemala | 3.2 /100 | #232 | Tragic 53.5% |
| Ugandans | 3.2 /100 | #233 | Tragic 53.5% |
| Immigrants | Switzerland | 3.0 /100 | #234 | Tragic 53.4% |
| Immigrants | Middle Africa | 3.0 /100 | #235 | Tragic 53.4% |
| Indonesians | 2.7 /100 | #236 | Tragic 53.4% |
| Macedonians | 2.4 /100 | #237 | Tragic 53.3% |
| Immigrants | Armenia | 2.3 /100 | #238 | Tragic 53.3% |
| Cambodians | 2.3 /100 | #239 | Tragic 53.3% |
| Immigrants | Europe | 2.1 /100 | #240 | Tragic 53.2% |
| Immigrants | Sierra Leone | 2.1 /100 | #241 | Tragic 53.2% |
| Immigrants | Eastern Asia | 2.1 /100 | #242 | Tragic 53.2% |
| Ethiopians | 1.7 /100 | #243 | Tragic 53.1% |
| Indians (Asian) | 1.7 /100 | #244 | Tragic 53.1% |