Bhutanese vs Immigrants from Somalia No Vehicles in Household

COMPARE

Bhutanese
Race
Ancestry
AfghanAfricanAlaska NativeAlaskan AthabascanAlbanianAleutAlsatianAmericanApacheArabArapahoArgentineanArmenianAssyrian/Chaldean/SyriacAustralianAustrianBahamianBangladeshiBarbadianBasqueBelgianBelizeanBermudanBhutaneseBlackfeetBolivianBrazilianBritishBritish West IndianBulgarianBurmeseCajunCambodianCanadianCape VerdeanCarpatho RusynCelticCentral AmericanCentral American IndianCherokeeCheyenneChickasawChileanChineseChippewaChoctawColombianColvilleComancheCosta RicanCreeCreekCroatianCrowCubanCypriotCzechCzechoslovakianDanishDelawareDominicanDutchDutch West IndianEastern EuropeanEcuadorianEgyptianEnglishEstonianEthiopianEuropeanFijianFilipinoFinnishFrenchFrench American IndianFrench CanadianGermanGerman RussianGhanaianGreekGuamanian/ChamorroGuatemalanGuyaneseHaitianHmongHonduranHopiHoumaHungarianIcelanderIndian (Asian)IndonesianInupiatIranianIraqiIrishIroquoisIsraeliItalianJamaicanJapaneseJordanianKenyanKiowaKoreanLaotianLatvianLebaneseLiberianLithuanianLumbeeLuxembourgerMacedonianMalaysianMalteseMarshalleseMenomineeMexicanMexican American IndianMongolianMoroccanNative HawaiianNavajoNepaleseNew ZealanderNicaraguanNigerianNorthern EuropeanNorwegianOkinawanOsageOttawaPaiutePakistaniPalestinianPanamanianParaguayanPennsylvania GermanPeruvianPimaPolishPortuguesePotawatomiPuebloPuerto RicanPuget Sound SalishRomanianRussianSalvadoranSamoanScandinavianScotch-IrishScottishSeminoleSenegaleseSerbianShoshoneSierra LeoneanSiouxSlavicSlovakSloveneSomaliSouth AfricanSouth AmericanSouth American IndianSoviet UnionSpaniardSpanishSpanish AmericanSpanish American IndianSri LankanSubsaharan AfricanSudaneseSwedishSwissSyrianTaiwaneseThaiTlingit-HaidaTohono O'OdhamTonganTrinidadian and TobagonianTsimshianTurkishU.S. Virgin IslanderUgandanUkrainianUruguayanUteVenezuelanVietnameseWelshWest IndianYakamaYaquiYugoslavianYumanYup'ikZimbabwean
Immigration
NonimmigrantsImmigrantsAfghanistanAfricaAlbaniaArgentinaArmeniaAsiaAustraliaAustriaBahamasBangladeshBarbadosBelarusBelgiumBelizeBoliviaBosnia and HerzegovinaBrazilBulgariaBurma/MyanmarCabo VerdeCambodiaCameroonCanadaCaribbeanCentral AmericaChileChinaColombiaCongoCosta RicaCroatiaCubaCzechoslovakiaDenmarkDominicaDominican RepublicEastern AfricaEastern AsiaEastern EuropeEcuadorEgyptEl SalvadorEnglandEritreaEthiopiaEuropeFijiFranceGermanyGhanaGreeceGrenadaGuatemalaGuyanaHaitiHondurasHong KongHungaryIndiaIndonesiaIranIraqIrelandIsraelItalyJamaicaJapanJordanKazakhstanKenyaKoreaKuwaitLaosLatin AmericaLatviaLebanonLiberiaLithuaniaMalaysiaMexicoMicronesiaMiddle AfricaMoldovaMoroccoNepalNetherlandsNicaraguaNigeriaNorth AmericaNorth MacedoniaNorthern AfricaNorthern EuropeNorwayOceaniaPakistanPanamaPeruPhilippinesPolandPortugalRomaniaRussiaSaudi ArabiaScotlandSenegalSerbiaSierra LeoneSingaporeSouth AfricaSouth AmericaSouth Central AsiaSouth Eastern AsiaSouthern EuropeSpainSri LankaSt. Vincent and the GrenadinesSudanSwedenSwitzerlandSyriaTaiwanThailandTrinidad and TobagoTurkeyUgandaUkraineUruguayUzbekistanVenezuelaVietnamWest IndiesWestern AfricaWestern AsiaWestern EuropeYemenZaireZimbabweAzores
Immigrants from Somalia
Race
Ancestry
AfghanAfricanAlaska NativeAlaskan AthabascanAlbanianAleutAlsatianAmericanApacheArabArapahoArgentineanArmenianAssyrian/Chaldean/SyriacAustralianAustrianBahamianBangladeshiBarbadianBasqueBelgianBelizeanBermudanBlackfeetBolivianBrazilianBritishBritish West IndianBulgarianBurmeseCajunCambodianCanadianCape VerdeanCarpatho RusynCelticCentral AmericanCentral American IndianCherokeeCheyenneChickasawChileanChineseChippewaChoctawColombianColvilleComancheCosta RicanCreeCreekCroatianCrowCubanCypriotCzechCzechoslovakianDanishDelawareDominicanDutchDutch West IndianEastern EuropeanEcuadorianEgyptianEnglishEstonianEthiopianEuropeanFijianFilipinoFinnishFrenchFrench American IndianFrench CanadianGermanGerman RussianGhanaianGreekGuamanian/ChamorroGuatemalanGuyaneseHaitianHmongHonduranHopiHoumaHungarianIcelanderIndian (Asian)IndonesianInupiatIranianIraqiIrishIroquoisIsraeliItalianJamaicanJapaneseJordanianKenyanKiowaKoreanLaotianLatvianLebaneseLiberianLithuanianLumbeeLuxembourgerMacedonianMalaysianMalteseMarshalleseMenomineeMexicanMexican American IndianMongolianMoroccanNative HawaiianNavajoNepaleseNew ZealanderNicaraguanNigerianNorthern EuropeanNorwegianOkinawanOsageOttawaPaiutePakistaniPalestinianPanamanianParaguayanPennsylvania GermanPeruvianPimaPolishPortuguesePotawatomiPuebloPuerto RicanPuget Sound SalishRomanianRussianSalvadoranSamoanScandinavianScotch-IrishScottishSeminoleSenegaleseSerbianShoshoneSierra LeoneanSiouxSlavicSlovakSloveneSomaliSouth AfricanSouth AmericanSouth American IndianSoviet UnionSpaniardSpanishSpanish AmericanSpanish American IndianSri LankanSubsaharan AfricanSudaneseSwedishSwissSyrianTaiwaneseThaiTlingit-HaidaTohono O'OdhamTonganTrinidadian and TobagonianTsimshianTurkishU.S. Virgin IslanderUgandanUkrainianUruguayanUteVenezuelanVietnameseWelshWest IndianYakamaYaquiYugoslavianYumanYup'ikZimbabwean
Immigration
NonimmigrantsImmigrantsAfghanistanAfricaAlbaniaArgentinaArmeniaAsiaAustraliaAustriaBahamasBangladeshBarbadosBelarusBelgiumBelizeBoliviaBosnia and HerzegovinaBrazilBulgariaBurma/MyanmarCabo VerdeCambodiaCameroonCanadaCaribbeanCentral AmericaChileChinaColombiaCongoCosta RicaCroatiaCubaCzechoslovakiaDenmarkDominicaDominican RepublicEastern AfricaEastern AsiaEastern EuropeEcuadorEgyptEl SalvadorEnglandEritreaEthiopiaEuropeFijiFranceGermanyGhanaGreeceGrenadaGuatemalaGuyanaHaitiHondurasHong KongHungaryIndiaIndonesiaIranIraqIrelandIsraelItalyJamaicaJapanJordanKazakhstanKenyaKoreaKuwaitLaosLatin AmericaLatviaLebanonLiberiaLithuaniaMalaysiaMexicoMicronesiaMiddle AfricaMoldovaMoroccoNepalNetherlandsNicaraguaNigeriaNorth AmericaNorth MacedoniaNorthern AfricaNorthern EuropeNorwayOceaniaPakistanPanamaPeruPhilippinesPolandPortugalRomaniaRussiaSaudi ArabiaScotlandSenegalSerbiaSierra LeoneSingaporeSomaliaSouth AfricaSouth AmericaSouth Central AsiaSouth Eastern AsiaSouthern EuropeSpainSri LankaSt. Vincent and the GrenadinesSudanSwedenSwitzerlandSyriaTaiwanThailandTrinidad and TobagoTurkeyUgandaUkraineUruguayUzbekistanVenezuelaVietnamWest IndiesWestern AfricaWestern AsiaWestern EuropeYemenZaireZimbabweAzores
No Vehicles in Household
Income
Poverty
Unemployment
Labor Participation
Family Structure
Vehicle Availability
Education Level
Disability

No Vehicles in Household Comparison

Bhutanese

Immigrants from Somalia

Exceptional
Tragic
8.7%
NO VEHICLES IN HOUSEHOLD
99.2/ 100
METRIC RATING
90th/ 347
METRIC RANK
11.4%
NO VEHICLES IN HOUSEHOLD
5.4/ 100
METRIC RATING
226th/ 347
METRIC RANK

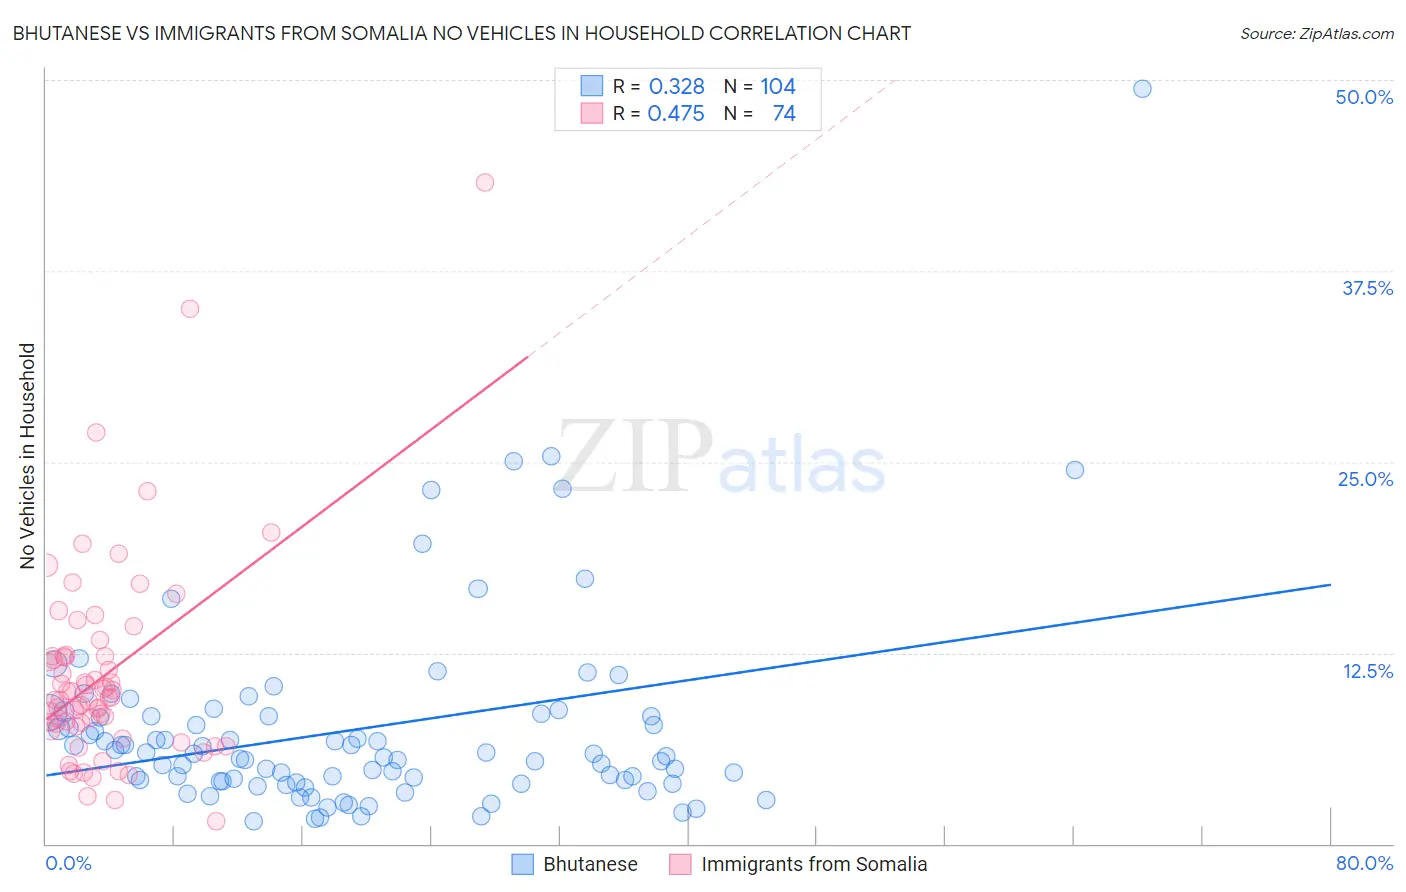
Bhutanese vs Immigrants from Somalia No Vehicles in Household Correlation Chart

The statistical analysis conducted on geographies consisting of 453,743,315 people shows a mild positive correlation between the proportion of Bhutanese and percentage of households with no vehicle available in the United States with a correlation coefficient (R) of 0.328 and weighted average of 8.7%. Similarly, the statistical analysis conducted on geographies consisting of 92,070,228 people shows a moderate positive correlation between the proportion of Immigrants from Somalia and percentage of households with no vehicle available in the United States with a correlation coefficient (R) of 0.475 and weighted average of 11.4%, a difference of 30.9%.
Bhutanese vs Immigrants from Somalia No Vehicles in Household

No Vehicles in Household Correlation Summary

MeasurementBhutaneseImmigrants from Somalia
Minimum1.5%1.4%
Maximum49.5%43.3%
Range48.0%41.9%
Mean7.5%11.0%
Median5.8%9.5%
Interquartile 25% (IQ1)4.1%7.7%
Interquartile 75% (IQ3)8.3%12.3%
Interquartile Range (IQR)4.3%4.6%
Standard Deviation (Sample)6.6%6.7%
Standard Deviation (Population)6.6%6.6%

Similar Demographics by No Vehicles in Household

Demographics Similar to Bhutanese by No Vehicles in Household

In terms of no vehicles in household, the demographic groups most similar to Bhutanese are Immigrants from Cuba (8.7%, a difference of 0.090%), Immigrants from Germany (8.7%, a difference of 0.19%), Immigrants from Canada (8.7%, a difference of 0.22%), Osage (8.7%, a difference of 0.23%), and Immigrants from England (8.7%, a difference of 0.35%).
DemographicsRating | RankNo Vehicles in Household
Italians
99.4
/100
|
#83
Exceptional
8.6%
Immigrants | Jordan
99.3
/100
|
#84
Exceptional
8.7%
Lebanese
99.3
/100
|
#85
Exceptional
8.7%
Bangladeshis
99.3
/100
|
#86
Exceptional
8.7%
Immigrants | England
99.2
/100
|
#87
Exceptional
8.7%
Osage
99.2
/100
|
#88
Exceptional
8.7%
Immigrants | Cuba
99.2
/100
|
#89
Exceptional
8.7%
Bhutanese
99.2
/100
|
#90
Exceptional
8.7%
Immigrants | Germany
99.1
/100
|
#91
Exceptional
8.7%
Immigrants | Canada
99.1
/100
|
#92
Exceptional
8.7%
Immigrants | North America
99.1
/100
|
#93
Exceptional
8.7%
Austrians
98.9
/100
|
#94
Exceptional
8.8%
Potawatomi
98.8
/100
|
#95
Exceptional
8.8%
Immigrants | Bolivia
98.7
/100
|
#96
Exceptional
8.9%
Immigrants | Central America
98.5
/100
|
#97
Exceptional
8.9%

Demographics Similar to Immigrants from Somalia by No Vehicles in Household

In terms of no vehicles in household, the demographic groups most similar to Immigrants from Somalia are Immigrants from Pakistan (11.4%, a difference of 0.020%), Immigrants from Romania (11.4%, a difference of 0.060%), Ugandan (11.4%, a difference of 0.10%), Immigrants from Norway (11.4%, a difference of 0.23%), and Immigrants from Japan (11.4%, a difference of 0.23%).
DemographicsRating | RankNo Vehicles in Household
Argentineans
9.6
/100
|
#219
Tragic
11.2%
Immigrants | Zaire
9.6
/100
|
#220
Tragic
11.2%
Peruvians
8.4
/100
|
#221
Tragic
11.2%
Immigrants | South America
8.0
/100
|
#222
Tragic
11.3%
Uruguayans
7.7
/100
|
#223
Tragic
11.3%
Immigrants | Hong Kong
7.2
/100
|
#224
Tragic
11.3%
Immigrants | Sierra Leone
6.4
/100
|
#225
Tragic
11.3%
Immigrants | Somalia
5.4
/100
|
#226
Tragic
11.4%
Immigrants | Pakistan
5.4
/100
|
#227
Tragic
11.4%
Immigrants | Romania
5.3
/100
|
#228
Tragic
11.4%
Ugandans
5.3
/100
|
#229
Tragic
11.4%
Immigrants | Norway
5.1
/100
|
#230
Tragic
11.4%
Immigrants | Japan
5.1
/100
|
#231
Tragic
11.4%
Immigrants | Turkey
4.8
/100
|
#232
Tragic
11.5%
Houma
4.7
/100
|
#233
Tragic
11.5%