Belizean vs European 4 or more Vehicles in Household
COMPARE
Belizean
European
4 or more Vehicles in Household
4 or more Vehicles in Household Comparison
Belizeans
Europeans
6.3%
4 OR MORE VEHICLES IN HOUSEHOLD
44.5/ 100
METRIC RATING
178th/ 347
METRIC RANK
7.6%
4 OR MORE VEHICLES IN HOUSEHOLD
100.0/ 100
METRIC RATING
61st/ 347
METRIC RANK
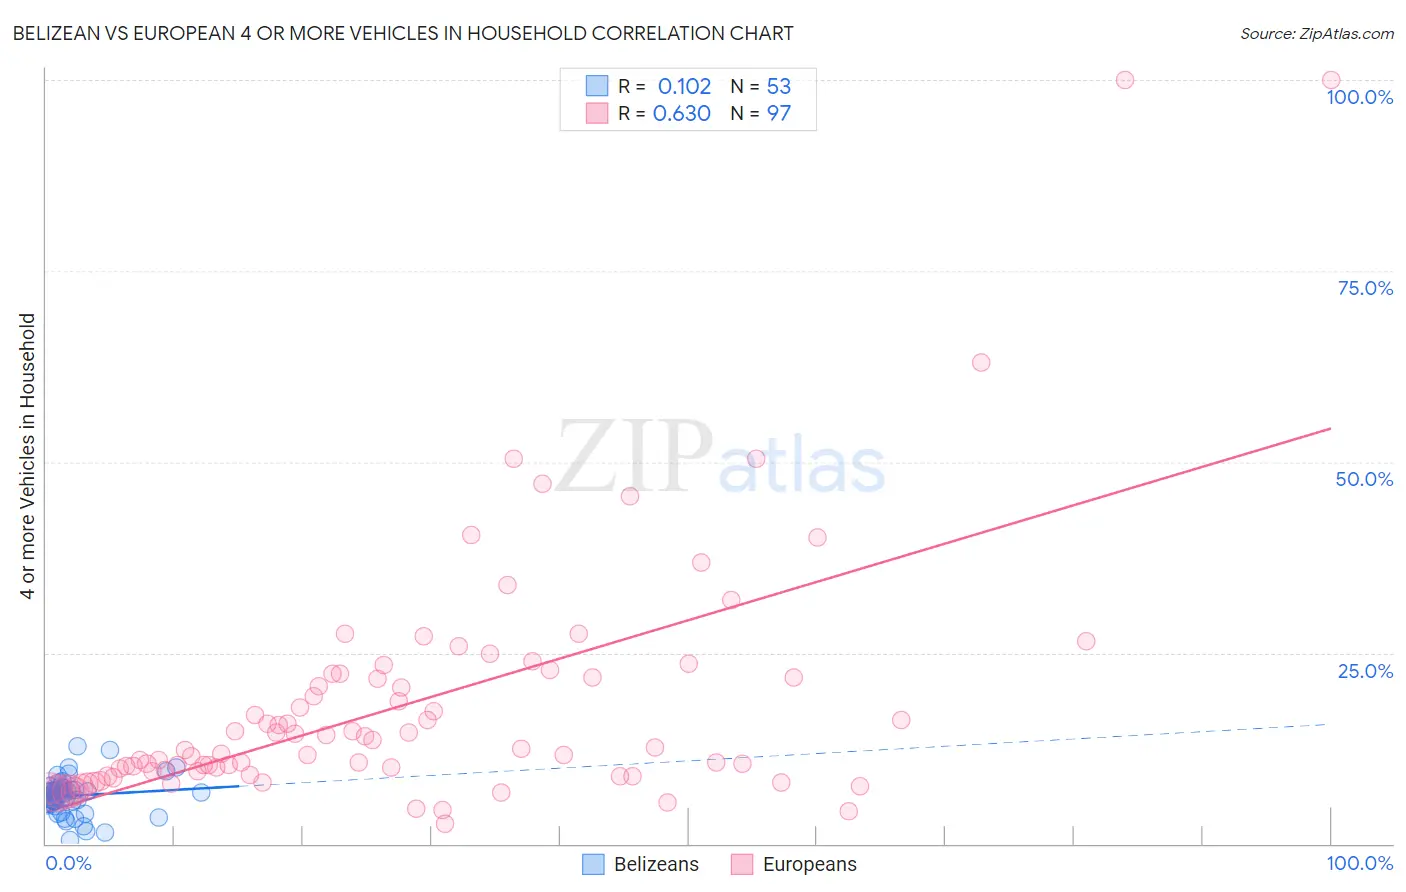
Belizean vs European 4 or more Vehicles in Household Correlation Chart
The statistical analysis conducted on geographies consisting of 143,595,749 people shows a poor positive correlation between the proportion of Belizeans and percentage of households with 4 or more vehicles available in the United States with a correlation coefficient (R) of 0.102 and weighted average of 6.3%. Similarly, the statistical analysis conducted on geographies consisting of 558,591,930 people shows a significant positive correlation between the proportion of Europeans and percentage of households with 4 or more vehicles available in the United States with a correlation coefficient (R) of 0.630 and weighted average of 7.6%, a difference of 20.7%.
4 or more Vehicles in Household Correlation Summary
| Measurement | Belizean | European |
| Minimum | 0.54% | 2.6% |
| Maximum | 12.8% | 100.0% |
| Range | 12.2% | 97.4% |
| Mean | 6.3% | 18.3% |
| Median | 6.6% | 12.5% |
| Interquartile 25% (IQ1) | 5.5% | 9.2% |
| Interquartile 75% (IQ3) | 7.2% | 22.0% |
| Interquartile Range (IQR) | 1.7% | 12.8% |
| Standard Deviation (Sample) | 2.4% | 16.5% |
| Standard Deviation (Population) | 2.4% | 16.4% |
Similar Demographics by 4 or more Vehicles in Household
Demographics Similar to Belizeans by 4 or more Vehicles in Household
In terms of 4 or more vehicles in household, the demographic groups most similar to Belizeans are Immigrants from Japan (6.3%, a difference of 0.15%), Slovak (6.3%, a difference of 0.24%), Syrian (6.3%, a difference of 0.27%), Ukrainian (6.3%, a difference of 0.31%), and Yugoslavian (6.3%, a difference of 0.35%).
| Demographics | Rating | Rank | 4 or more Vehicles in Household |
| Immigrants | India | 51.9 /100 | #171 | Average 6.3% |
| Immigrants | Lebanon | 51.7 /100 | #172 | Average 6.3% |
| Slovenes | 51.1 /100 | #173 | Average 6.3% |
| Lithuanians | 50.0 /100 | #174 | Average 6.3% |
| Immigrants | Western Europe | 48.8 /100 | #175 | Average 6.3% |
| Ukrainians | 47.6 /100 | #176 | Average 6.3% |
| Slovaks | 46.9 /100 | #177 | Average 6.3% |
| Belizeans | 44.5 /100 | #178 | Average 6.3% |
| Immigrants | Japan | 43.1 /100 | #179 | Average 6.3% |
| Syrians | 42.0 /100 | #180 | Average 6.3% |
| Yugoslavians | 41.1 /100 | #181 | Average 6.3% |
| South American Indians | 40.7 /100 | #182 | Average 6.3% |
| Immigrants | Burma/Myanmar | 37.5 /100 | #183 | Fair 6.2% |
| Iraqis | 37.3 /100 | #184 | Fair 6.2% |
| Thais | 36.9 /100 | #185 | Fair 6.2% |
Demographics Similar to Europeans by 4 or more Vehicles in Household
In terms of 4 or more vehicles in household, the demographic groups most similar to Europeans are Spaniard (7.6%, a difference of 0.26%), Chippewa (7.6%, a difference of 0.26%), Immigrants from Micronesia (7.6%, a difference of 0.27%), Hispanic or Latino (7.6%, a difference of 0.32%), and Pennsylvania German (7.6%, a difference of 0.36%).
| Demographics | Rating | Rank | 4 or more Vehicles in Household |
| Dutch | 100.0 /100 | #54 | Exceptional 7.7% |
| Immigrants | Oceania | 100.0 /100 | #55 | Exceptional 7.6% |
| English | 100.0 /100 | #56 | Exceptional 7.6% |
| Pennsylvania Germans | 100.0 /100 | #57 | Exceptional 7.6% |
| Swedes | 100.0 /100 | #58 | Exceptional 7.6% |
| Hispanics or Latinos | 100.0 /100 | #59 | Exceptional 7.6% |
| Spaniards | 100.0 /100 | #60 | Exceptional 7.6% |
| Europeans | 100.0 /100 | #61 | Exceptional 7.6% |
| Chippewa | 100.0 /100 | #62 | Exceptional 7.6% |
| Immigrants | Micronesia | 100.0 /100 | #63 | Exceptional 7.6% |
| Bangladeshis | 100.0 /100 | #64 | Exceptional 7.6% |
| Immigrants | Azores | 100.0 /100 | #65 | Exceptional 7.5% |
| Immigrants | Taiwan | 99.9 /100 | #66 | Exceptional 7.5% |
| Americans | 99.9 /100 | #67 | Exceptional 7.5% |
| Welsh | 99.9 /100 | #68 | Exceptional 7.5% |