Aleut vs Immigrants from Colombia 3 or more Vehicles in Household
COMPARE
Aleut
Immigrants from Colombia
3 or more Vehicles in Household
3 or more Vehicles in Household Comparison
Aleuts
Immigrants from Colombia
20.2%
3 OR MORE VEHICLES IN HOUSEHOLD
86.3/ 100
METRIC RATING
138th/ 347
METRIC RANK
17.3%
3 OR MORE VEHICLES IN HOUSEHOLD
0.3/ 100
METRIC RATING
284th/ 347
METRIC RANK
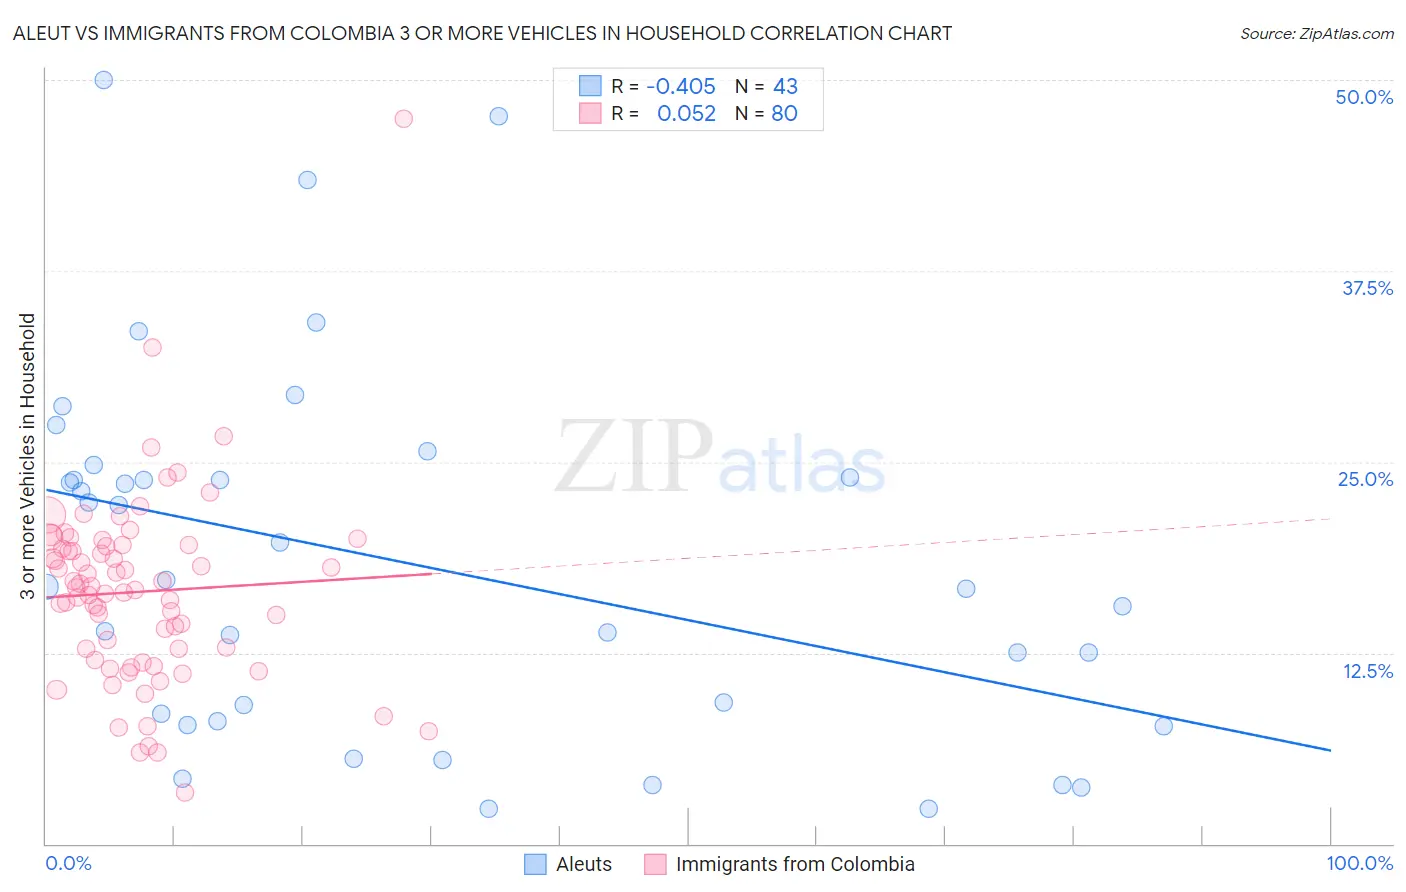
Aleut vs Immigrants from Colombia 3 or more Vehicles in Household Correlation Chart
The statistical analysis conducted on geographies consisting of 61,759,938 people shows a moderate negative correlation between the proportion of Aleuts and percentage of households with 3 or more vehicles available in the United States with a correlation coefficient (R) of -0.405 and weighted average of 20.2%. Similarly, the statistical analysis conducted on geographies consisting of 378,439,541 people shows a slight positive correlation between the proportion of Immigrants from Colombia and percentage of households with 3 or more vehicles available in the United States with a correlation coefficient (R) of 0.052 and weighted average of 17.3%, a difference of 16.6%.
3 or more Vehicles in Household Correlation Summary
| Measurement | Aleut | Immigrants from Colombia |
| Minimum | 2.3% | 3.3% |
| Maximum | 50.0% | 47.5% |
| Range | 47.7% | 44.2% |
| Mean | 18.3% | 16.5% |
| Median | 16.8% | 16.7% |
| Interquartile 25% (IQ1) | 8.0% | 12.4% |
| Interquartile 75% (IQ3) | 24.0% | 19.5% |
| Interquartile Range (IQR) | 16.0% | 7.1% |
| Standard Deviation (Sample) | 12.0% | 6.3% |
| Standard Deviation (Population) | 11.8% | 6.2% |
Similar Demographics by 3 or more Vehicles in Household
Demographics Similar to Aleuts by 3 or more Vehicles in Household
In terms of 3 or more vehicles in household, the demographic groups most similar to Aleuts are Immigrants from Nicaragua (20.2%, a difference of 0.12%), Immigrants from Iraq (20.2%, a difference of 0.12%), Slovene (20.2%, a difference of 0.12%), Immigrants from India (20.2%, a difference of 0.13%), and French American Indian (20.1%, a difference of 0.15%).
| Demographics | Rating | Rank | 3 or more Vehicles in Household |
| Immigrants | Asia | 88.1 /100 | #131 | Excellent 20.2% |
| Immigrants | Canada | 87.8 /100 | #132 | Excellent 20.2% |
| Immigrants | North America | 87.8 /100 | #133 | Excellent 20.2% |
| Poles | 87.3 /100 | #134 | Excellent 20.2% |
| Immigrants | India | 87.2 /100 | #135 | Excellent 20.2% |
| Immigrants | Nicaragua | 87.1 /100 | #136 | Excellent 20.2% |
| Immigrants | Iraq | 87.1 /100 | #137 | Excellent 20.2% |
| Aleuts | 86.3 /100 | #138 | Excellent 20.2% |
| Slovenes | 85.5 /100 | #139 | Excellent 20.2% |
| French American Indians | 85.3 /100 | #140 | Excellent 20.1% |
| Ottawa | 84.9 /100 | #141 | Excellent 20.1% |
| Jordanians | 84.4 /100 | #142 | Excellent 20.1% |
| Lithuanians | 84.4 /100 | #143 | Excellent 20.1% |
| Iranians | 84.0 /100 | #144 | Excellent 20.1% |
| Palestinians | 83.9 /100 | #145 | Excellent 20.1% |
Demographics Similar to Immigrants from Colombia by 3 or more Vehicles in Household
In terms of 3 or more vehicles in household, the demographic groups most similar to Immigrants from Colombia are Black/African American (17.3%, a difference of 0.12%), Immigrants from Ireland (17.3%, a difference of 0.17%), Immigrants from Latvia (17.4%, a difference of 0.46%), Immigrants from Eastern Europe (17.4%, a difference of 0.50%), and Immigrants from Kazakhstan (17.4%, a difference of 0.54%).
| Demographics | Rating | Rank | 3 or more Vehicles in Household |
| Brazilians | 0.4 /100 | #277 | Tragic 17.4% |
| Immigrants | Bahamas | 0.3 /100 | #278 | Tragic 17.4% |
| Immigrants | Kazakhstan | 0.3 /100 | #279 | Tragic 17.4% |
| Immigrants | Eastern Europe | 0.3 /100 | #280 | Tragic 17.4% |
| Immigrants | Latvia | 0.3 /100 | #281 | Tragic 17.4% |
| Immigrants | Ireland | 0.3 /100 | #282 | Tragic 17.3% |
| Blacks/African Americans | 0.3 /100 | #283 | Tragic 17.3% |
| Immigrants | Colombia | 0.3 /100 | #284 | Tragic 17.3% |
| Immigrants | Croatia | 0.2 /100 | #285 | Tragic 17.2% |
| Menominee | 0.2 /100 | #286 | Tragic 17.2% |
| Immigrants | Brazil | 0.2 /100 | #287 | Tragic 17.1% |
| Immigrants | Uruguay | 0.2 /100 | #288 | Tragic 17.1% |
| Immigrants | Liberia | 0.1 /100 | #289 | Tragic 17.1% |
| Liberians | 0.1 /100 | #290 | Tragic 17.0% |
| Immigrants | Congo | 0.1 /100 | #291 | Tragic 17.0% |