Alaskan Athabascan vs Immigrants from Turkey No Vehicles in Household
COMPARE
Alaskan Athabascan
Immigrants from Turkey
No Vehicles in Household
No Vehicles in Household Comparison
Alaskan Athabascans
Immigrants from Turkey
15.6%
NO VEHICLES IN HOUSEHOLD
0.0/ 100
METRIC RATING
312th/ 347
METRIC RANK
11.5%
NO VEHICLES IN HOUSEHOLD
4.8/ 100
METRIC RATING
232nd/ 347
METRIC RANK
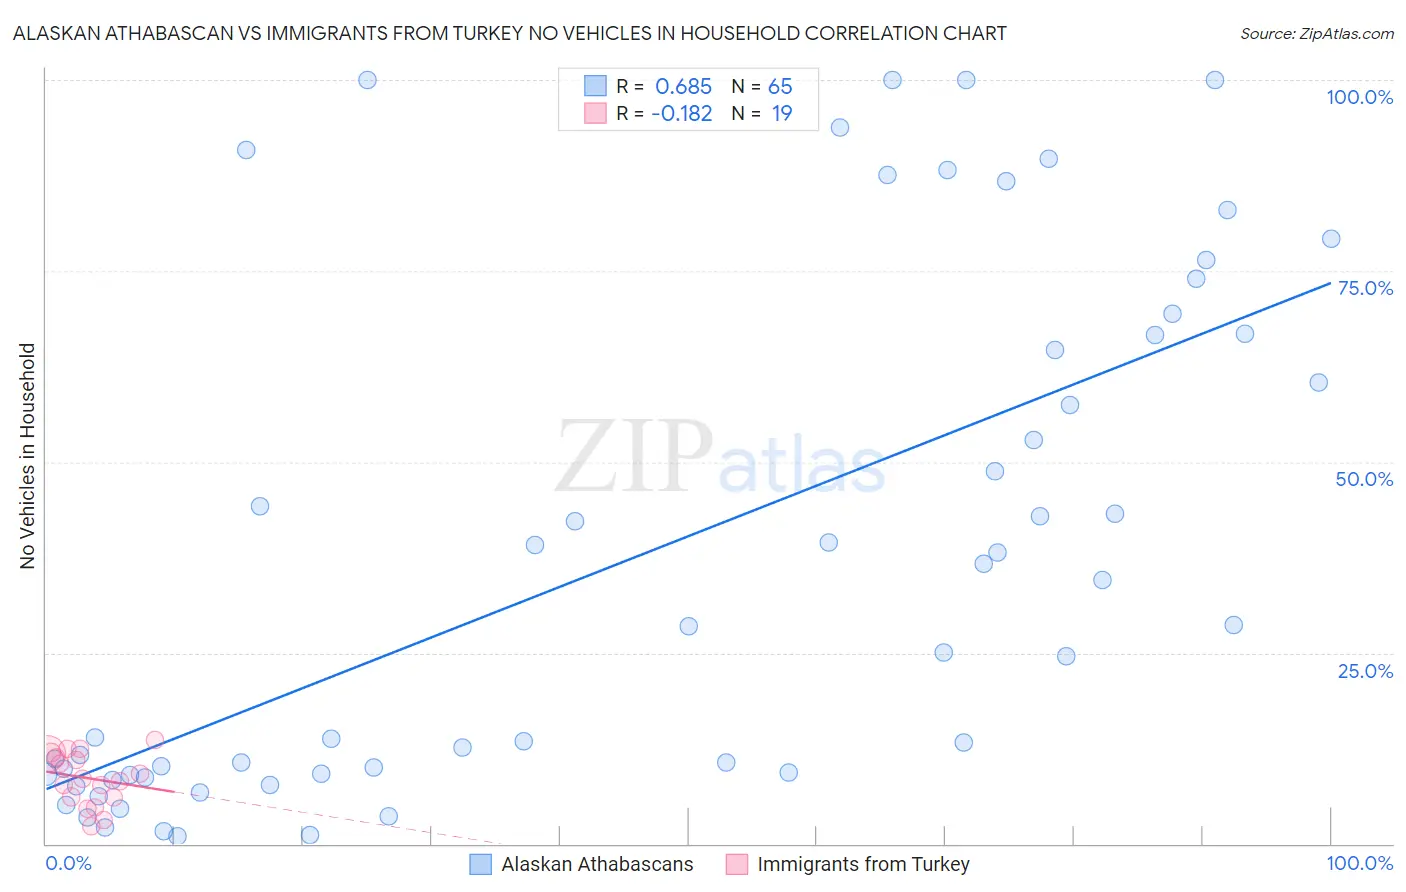
Alaskan Athabascan vs Immigrants from Turkey No Vehicles in Household Correlation Chart
The statistical analysis conducted on geographies consisting of 45,793,877 people shows a significant positive correlation between the proportion of Alaskan Athabascans and percentage of households with no vehicle available in the United States with a correlation coefficient (R) of 0.685 and weighted average of 15.6%. Similarly, the statistical analysis conducted on geographies consisting of 222,854,300 people shows a poor negative correlation between the proportion of Immigrants from Turkey and percentage of households with no vehicle available in the United States with a correlation coefficient (R) of -0.182 and weighted average of 11.5%, a difference of 36.1%.
No Vehicles in Household Correlation Summary
| Measurement | Alaskan Athabascan | Immigrants from Turkey |
| Minimum | 1.0% | 2.2% |
| Maximum | 100.0% | 13.5% |
| Range | 99.0% | 11.3% |
| Mean | 37.7% | 8.6% |
| Median | 28.5% | 8.5% |
| Interquartile 25% (IQ1) | 9.1% | 6.1% |
| Interquartile 75% (IQ3) | 66.7% | 11.7% |
| Interquartile Range (IQR) | 57.6% | 5.6% |
| Standard Deviation (Sample) | 33.1% | 3.4% |
| Standard Deviation (Population) | 32.8% | 3.3% |
Similar Demographics by No Vehicles in Household
Demographics Similar to Alaskan Athabascans by No Vehicles in Household
In terms of no vehicles in household, the demographic groups most similar to Alaskan Athabascans are Immigrants from Israel (15.6%, a difference of 0.15%), Tohono O'odham (15.6%, a difference of 0.15%), Cape Verdean (15.6%, a difference of 0.16%), Albanian (15.6%, a difference of 0.31%), and Cypriot (15.7%, a difference of 0.44%).
| Demographics | Rating | Rank | No Vehicles in Household |
| Immigrants | China | 0.0 /100 | #305 | Tragic 15.2% |
| Immigrants | Belize | 0.0 /100 | #306 | Tragic 15.4% |
| Immigrants | Haiti | 0.0 /100 | #307 | Tragic 15.4% |
| U.S. Virgin Islanders | 0.0 /100 | #308 | Tragic 15.4% |
| Puerto Ricans | 0.0 /100 | #309 | Tragic 15.5% |
| Cape Verdeans | 0.0 /100 | #310 | Tragic 15.6% |
| Immigrants | Israel | 0.0 /100 | #311 | Tragic 15.6% |
| Alaskan Athabascans | 0.0 /100 | #312 | Tragic 15.6% |
| Tohono O'odham | 0.0 /100 | #313 | Tragic 15.6% |
| Albanians | 0.0 /100 | #314 | Tragic 15.6% |
| Cypriots | 0.0 /100 | #315 | Tragic 15.7% |
| Ghanaians | 0.0 /100 | #316 | Tragic 16.4% |
| Immigrants | Ghana | 0.0 /100 | #317 | Tragic 16.6% |
| Immigrants | Belarus | 0.0 /100 | #318 | Tragic 16.7% |
| Alaska Natives | 0.0 /100 | #319 | Tragic 17.4% |
Demographics Similar to Immigrants from Turkey by No Vehicles in Household
In terms of no vehicles in household, the demographic groups most similar to Immigrants from Turkey are Houma (11.5%, a difference of 0.040%), Immigrants from Norway (11.4%, a difference of 0.19%), Immigrants from Japan (11.4%, a difference of 0.19%), Immigrants from Peru (11.5%, a difference of 0.23%), and Ugandan (11.4%, a difference of 0.32%).
| Demographics | Rating | Rank | No Vehicles in Household |
| Immigrants | Sierra Leone | 6.4 /100 | #225 | Tragic 11.3% |
| Immigrants | Somalia | 5.4 /100 | #226 | Tragic 11.4% |
| Immigrants | Pakistan | 5.4 /100 | #227 | Tragic 11.4% |
| Immigrants | Romania | 5.3 /100 | #228 | Tragic 11.4% |
| Ugandans | 5.3 /100 | #229 | Tragic 11.4% |
| Immigrants | Norway | 5.1 /100 | #230 | Tragic 11.4% |
| Immigrants | Japan | 5.1 /100 | #231 | Tragic 11.4% |
| Immigrants | Turkey | 4.8 /100 | #232 | Tragic 11.5% |
| Houma | 4.7 /100 | #233 | Tragic 11.5% |
| Immigrants | Peru | 4.5 /100 | #234 | Tragic 11.5% |
| Kiowa | 4.0 /100 | #235 | Tragic 11.5% |
| Cree | 3.5 /100 | #236 | Tragic 11.6% |
| Ute | 3.3 /100 | #237 | Tragic 11.6% |
| Russians | 3.2 /100 | #238 | Tragic 11.6% |
| Taiwanese | 2.8 /100 | #239 | Tragic 11.7% |