Zip Codes with the Highest Percentage of Immigrants from Eastern Asia in Roanoke, VA
RELATED REPORTS & OPTIONS
Eastern Asia
Roanoke
Compare Zip Codes
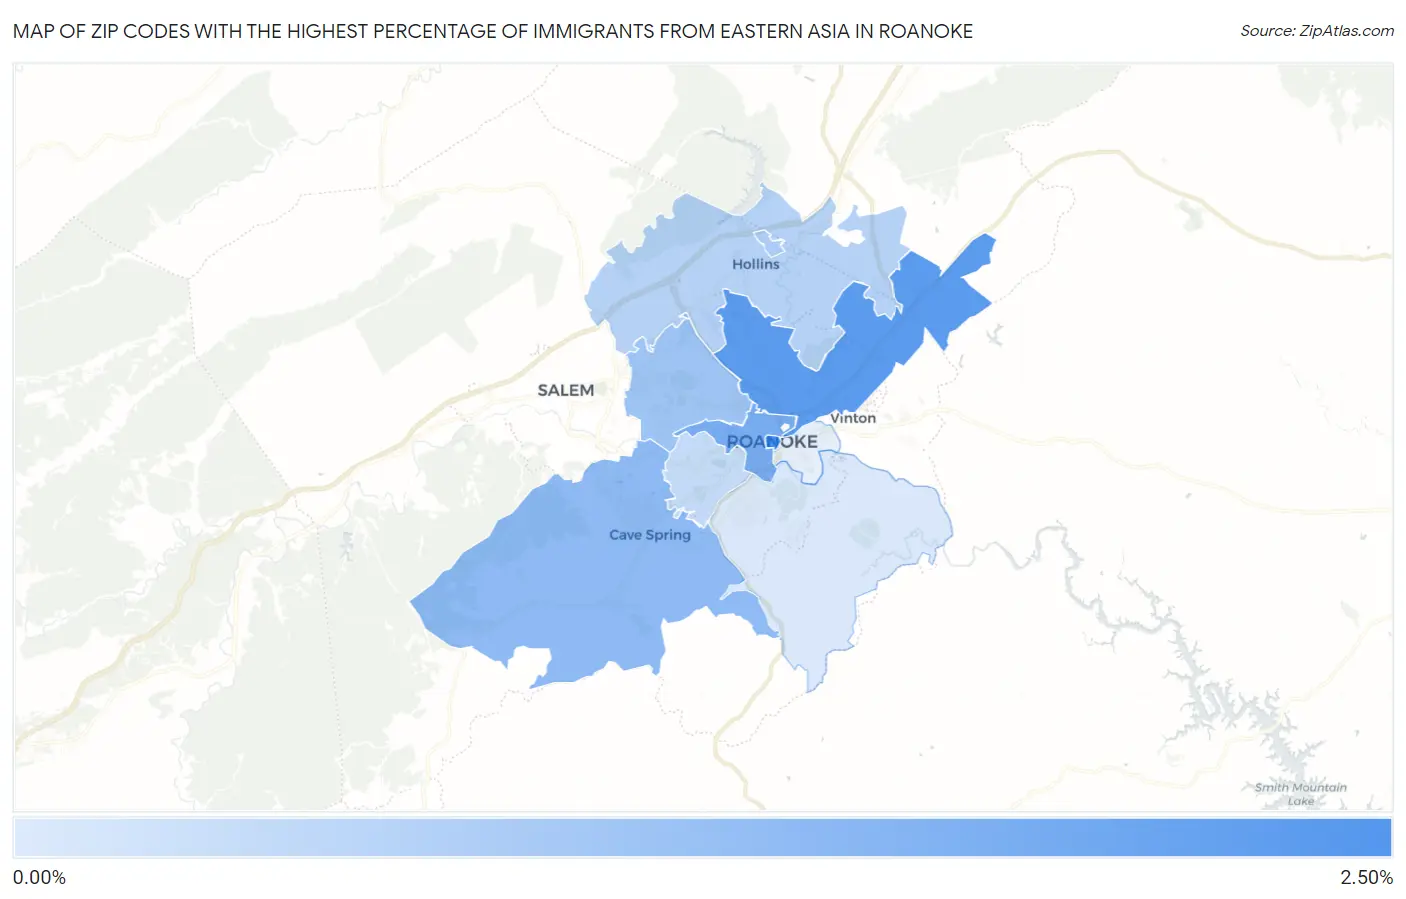
Map of Zip Codes with the Highest Percentage of Immigrants from Eastern Asia in Roanoke
0.045%
2.07%
Zip Codes with the Highest Percentage of Immigrants from Eastern Asia in Roanoke, VA
| Zip Code | Eastern Asia | vs State | vs National | |
| 1. | 24011 | 2.07% | 1.35%(+0.723)#61 | 1.28%(+0.799)#1,924 |
| 2. | 24012 | 1.77% | 1.35%(+0.419)#76 | 1.28%(+0.495)#2,268 |
| 3. | 24016 | 1.38% | 1.35%(+0.033)#92 | 1.28%(+0.109)#2,881 |
| 4. | 24018 | 1.07% | 1.35%(-0.283)#124 | 1.28%(-0.207)#3,681 |
| 5. | 24017 | 0.87% | 1.35%(-0.480)#142 | 1.28%(-0.404)#4,380 |
| 6. | 24020 | 0.68% | 1.35%(-0.671)#172 | 1.28%(-0.595)#5,352 |
| 7. | 24019 | 0.53% | 1.35%(-0.819)#191 | 1.28%(-0.744)#6,333 |
| 8. | 24015 | 0.34% | 1.35%(-1.02)#253 | 1.28%(-0.940)#8,314 |
| 9. | 24014 | 0.045% | 1.35%(-1.31)#366 | 1.28%(-1.23)#13,360 |
1
Common Questions
What are the Top 5 Zip Codes with the Highest Percentage of Immigrants from Eastern Asia in Roanoke, VA?
Top 5 Zip Codes with the Highest Percentage of Immigrants from Eastern Asia in Roanoke, VA are:
What zip code has the Highest Percentage of Immigrants from Eastern Asia in Roanoke, VA?
24011 has the Highest Percentage of Immigrants from Eastern Asia in Roanoke, VA with 2.07%.
What is the Percentage of Immigrants from Eastern Asia in Roanoke, VA?
Percentage of Immigrants from Eastern Asia in Roanoke is 1.01%.
What is the Percentage of Immigrants from Eastern Asia in Virginia?
Percentage of Immigrants from Eastern Asia in Virginia is 1.35%.
What is the Percentage of Immigrants from Eastern Asia in the United States?
Percentage of Immigrants from Eastern Asia in the United States is 1.28%.