Zip Codes with the Highest Percentage of Population Employed in Administrative & Support Services in Manassas, VA
RELATED REPORTS & OPTIONS
Administrative & Support Services
Manassas
Compare Zip Codes
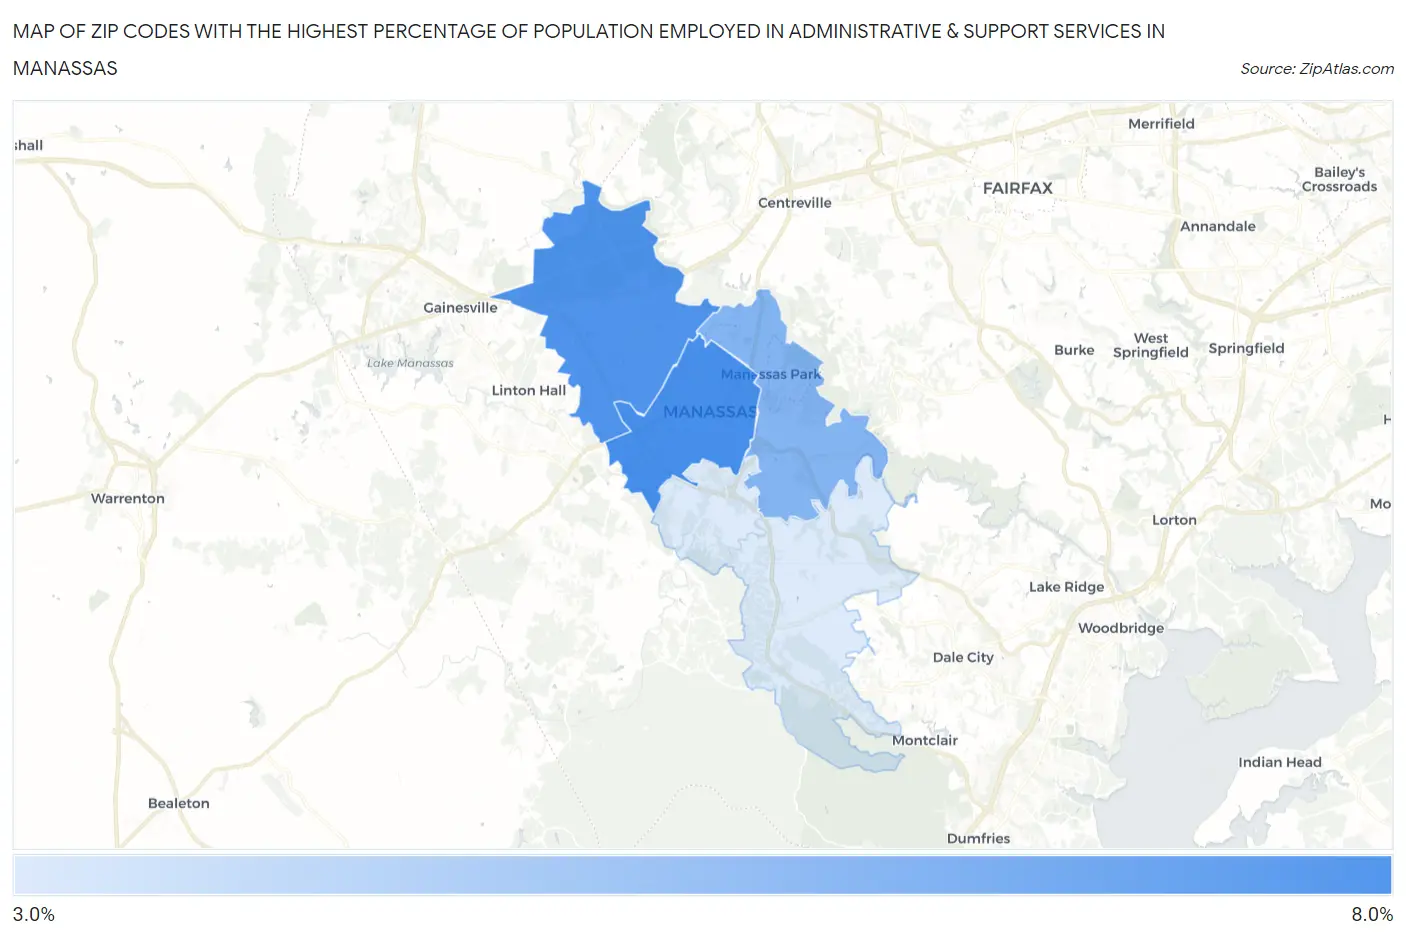
Map of Zip Codes with the Highest Percentage of Population Employed in Administrative & Support Services in Manassas
3.8%
7.5%
Zip Codes with the Highest Percentage of Population Employed in Administrative & Support Services in Manassas, VA
| Zip Code | % Employed | vs State | vs National | |
| 1. | 20110 | 7.5% | 4.1%(+3.37)#97 | 4.1%(+3.36)#2,681 |
| 2. | 20109 | 7.3% | 4.1%(+3.17)#100 | 4.1%(+3.15)#2,885 |
| 3. | 20111 | 6.0% | 4.1%(+1.89)#158 | 4.1%(+1.88)#4,724 |
| 4. | 20112 | 3.8% | 4.1%(-0.315)#339 | 4.1%(-0.328)#11,436 |
1
Common Questions
What are the Top 3 Zip Codes with the Highest Percentage of Population Employed in Administrative & Support Services in Manassas, VA?
Top 3 Zip Codes with the Highest Percentage of Population Employed in Administrative & Support Services in Manassas, VA are:
What zip code has the Highest Percentage of Population Employed in Administrative & Support Services in Manassas, VA?
20110 has the Highest Percentage of Population Employed in Administrative & Support Services in Manassas, VA with 7.5%.
What is the Percentage of Population Employed in Administrative & Support Services in Manassas, VA?
Percentage of Population Employed in Administrative & Support Services in Manassas is 7.3%.
What is the Percentage of Population Employed in Administrative & Support Services in Virginia?
Percentage of Population Employed in Administrative & Support Services in Virginia is 4.1%.
What is the Percentage of Population Employed in Administrative & Support Services in the United States?
Percentage of Population Employed in Administrative & Support Services in the United States is 4.1%.