Zip Codes with the Highest Percentage of Population Employed in Legal Services & Support in Richmond, VA
RELATED REPORTS & OPTIONS
Legal Services & Support
Richmond
Compare Zip Codes
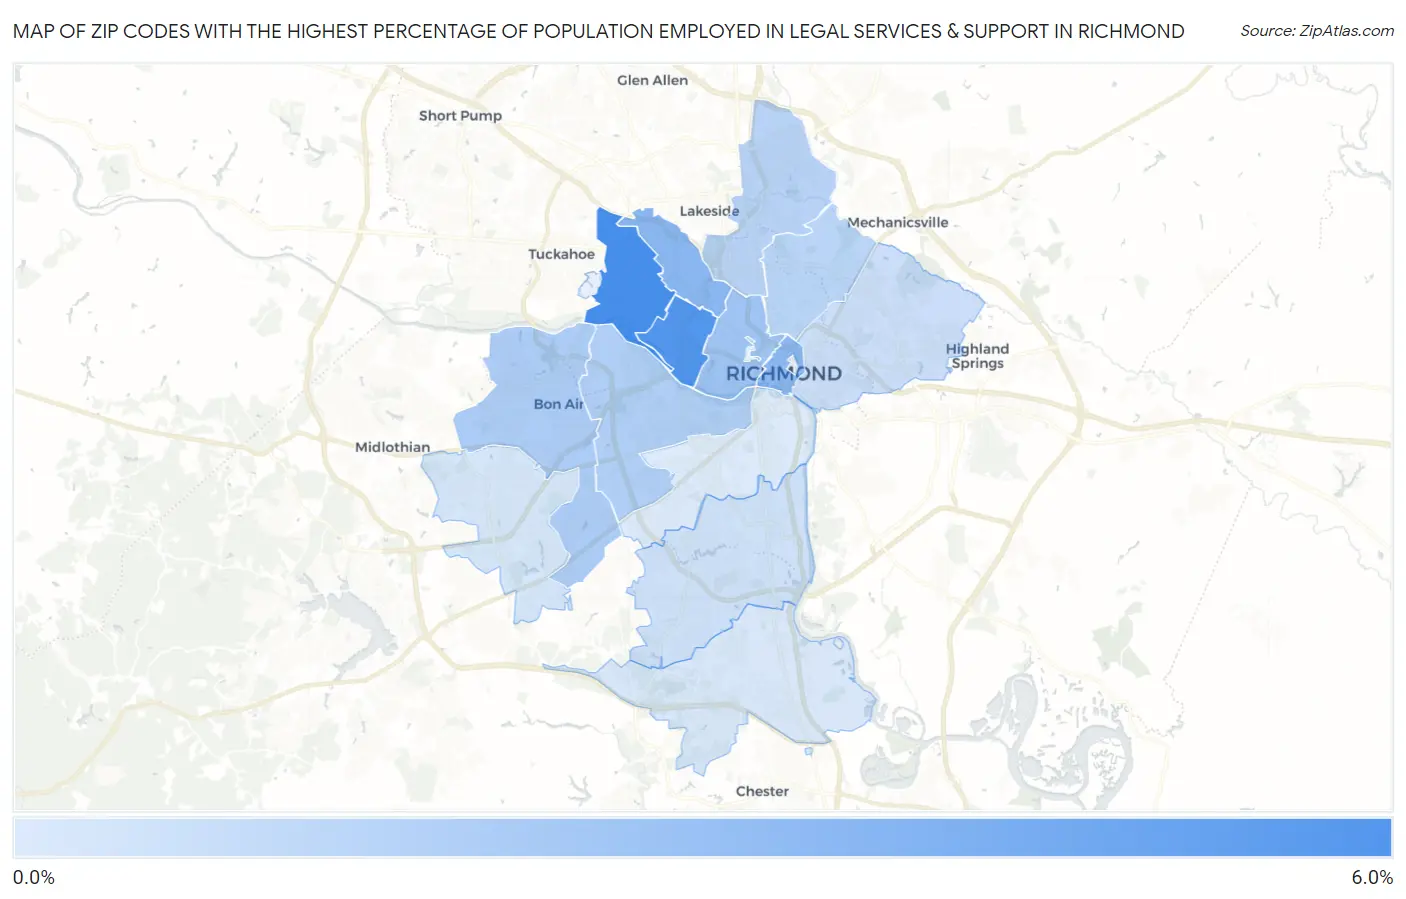
Map of Zip Codes with the Highest Percentage of Population Employed in Legal Services & Support in Richmond
0.059%
5.7%
Zip Codes with the Highest Percentage of Population Employed in Legal Services & Support in Richmond, VA
| Zip Code | % Employed | vs State | vs National | |
| 1. | 23226 | 5.7% | 1.6%(+4.10)#29 | 1.2%(+4.54)#551 |
| 2. | 23221 | 5.3% | 1.6%(+3.63)#39 | 1.2%(+4.07)#650 |
| 3. | 23230 | 3.1% | 1.6%(+1.51)#76 | 1.2%(+1.95)#1,716 |
| 4. | 23219 | 3.1% | 1.6%(+1.46)#78 | 1.2%(+1.90)#1,769 |
| 5. | 23220 | 2.2% | 1.6%(+0.626)#116 | 1.2%(+1.06)#2,940 |
| 6. | 23235 | 1.9% | 1.6%(+0.251)#140 | 1.2%(+0.689)#3,806 |
| 7. | 23225 | 1.7% | 1.6%(+0.036)#163 | 1.2%(+0.474)#4,468 |
| 8. | 23227 | 1.4% | 1.6%(-0.206)#190 | 1.2%(+0.232)#5,391 |
| 9. | 23222 | 1.3% | 1.6%(-0.281)#199 | 1.2%(+0.157)#5,729 |
| 10. | 23223 | 0.71% | 1.6%(-0.915)#310 | 1.2%(-0.476)#10,333 |
| 11. | 23234 | 0.57% | 1.6%(-1.06)#348 | 1.2%(-0.617)#11,871 |
| 12. | 23236 | 0.32% | 1.6%(-1.30)#403 | 1.2%(-0.860)#14,770 |
| 13. | 23237 | 0.23% | 1.6%(-1.39)#427 | 1.2%(-0.952)#15,850 |
| 14. | 23224 | 0.059% | 1.6%(-1.56)#457 | 1.2%(-1.13)#17,396 |
1
Common Questions
What are the Top 10 Zip Codes with the Highest Percentage of Population Employed in Legal Services & Support in Richmond, VA?
Top 10 Zip Codes with the Highest Percentage of Population Employed in Legal Services & Support in Richmond, VA are:
What zip code has the Highest Percentage of Population Employed in Legal Services & Support in Richmond, VA?
23226 has the Highest Percentage of Population Employed in Legal Services & Support in Richmond, VA with 5.7%.
What is the Percentage of Population Employed in Legal Services & Support in Richmond, VA?
Percentage of Population Employed in Legal Services & Support in Richmond is 2.1%.
What is the Percentage of Population Employed in Legal Services & Support in Virginia?
Percentage of Population Employed in Legal Services & Support in Virginia is 1.6%.
What is the Percentage of Population Employed in Legal Services & Support in the United States?
Percentage of Population Employed in Legal Services & Support in the United States is 1.2%.