Zip Codes with the Highest Percentage of Population Employed in Agriculture, Fishing & Hunting in Saint George, UT
RELATED REPORTS & OPTIONS
Agriculture, Fishing & Hunting
Saint George
Compare Zip Codes
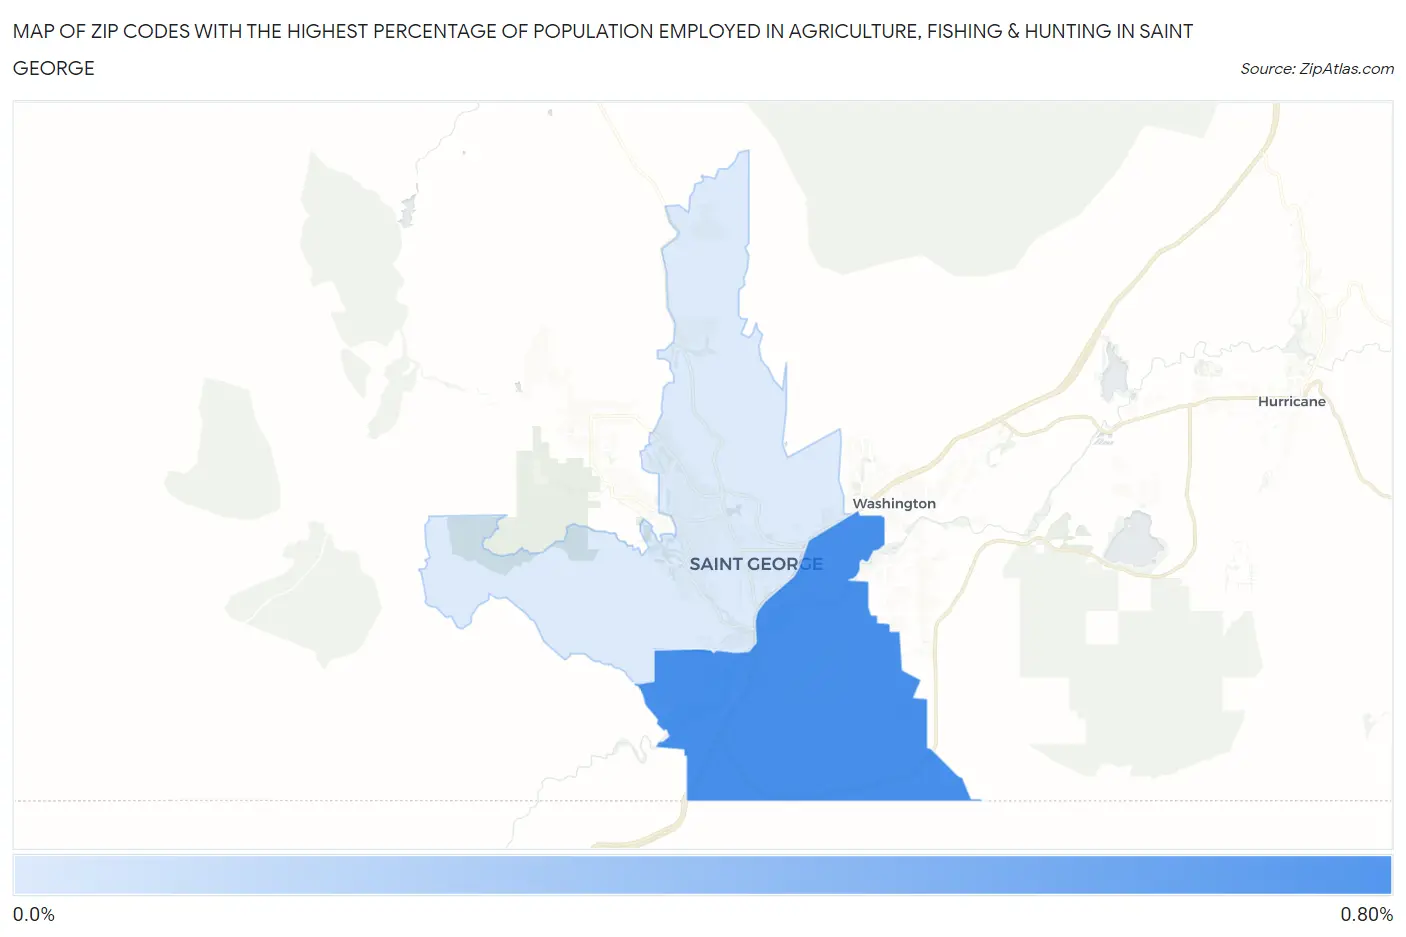
Map of Zip Codes with the Highest Percentage of Population Employed in Agriculture, Fishing & Hunting in Saint George
0.10%
0.71%
Zip Codes with the Highest Percentage of Population Employed in Agriculture, Fishing & Hunting in Saint George, UT
| Zip Code | % Employed | vs State | vs National | |
| 1. | 84790 | 0.71% | 0.72%(-0.013)#150 | 1.2%(-0.489)#17,793 |
| 2. | 84770 | 0.10% | 0.72%(-0.621)#218 | 1.2%(-1.10)#23,650 |
1
Common Questions
What are the Top Zip Codes with the Highest Percentage of Population Employed in Agriculture, Fishing & Hunting in Saint George, UT?
Top Zip Codes with the Highest Percentage of Population Employed in Agriculture, Fishing & Hunting in Saint George, UT are:
What zip code has the Highest Percentage of Population Employed in Agriculture, Fishing & Hunting in Saint George, UT?
84790 has the Highest Percentage of Population Employed in Agriculture, Fishing & Hunting in Saint George, UT with 0.71%.
What is the Percentage of Population Employed in Agriculture, Fishing & Hunting in Utah?
Percentage of Population Employed in Agriculture, Fishing & Hunting in Utah is 0.72%.
What is the Percentage of Population Employed in Agriculture, Fishing & Hunting in the United States?
Percentage of Population Employed in Agriculture, Fishing & Hunting in the United States is 1.2%.