Zip Codes with the Highest Percentage of Population Employed in Health Diagnosing & Treating in Ogden, UT
RELATED REPORTS & OPTIONS
Health Diagnosing & Treating
Ogden
Compare Zip Codes
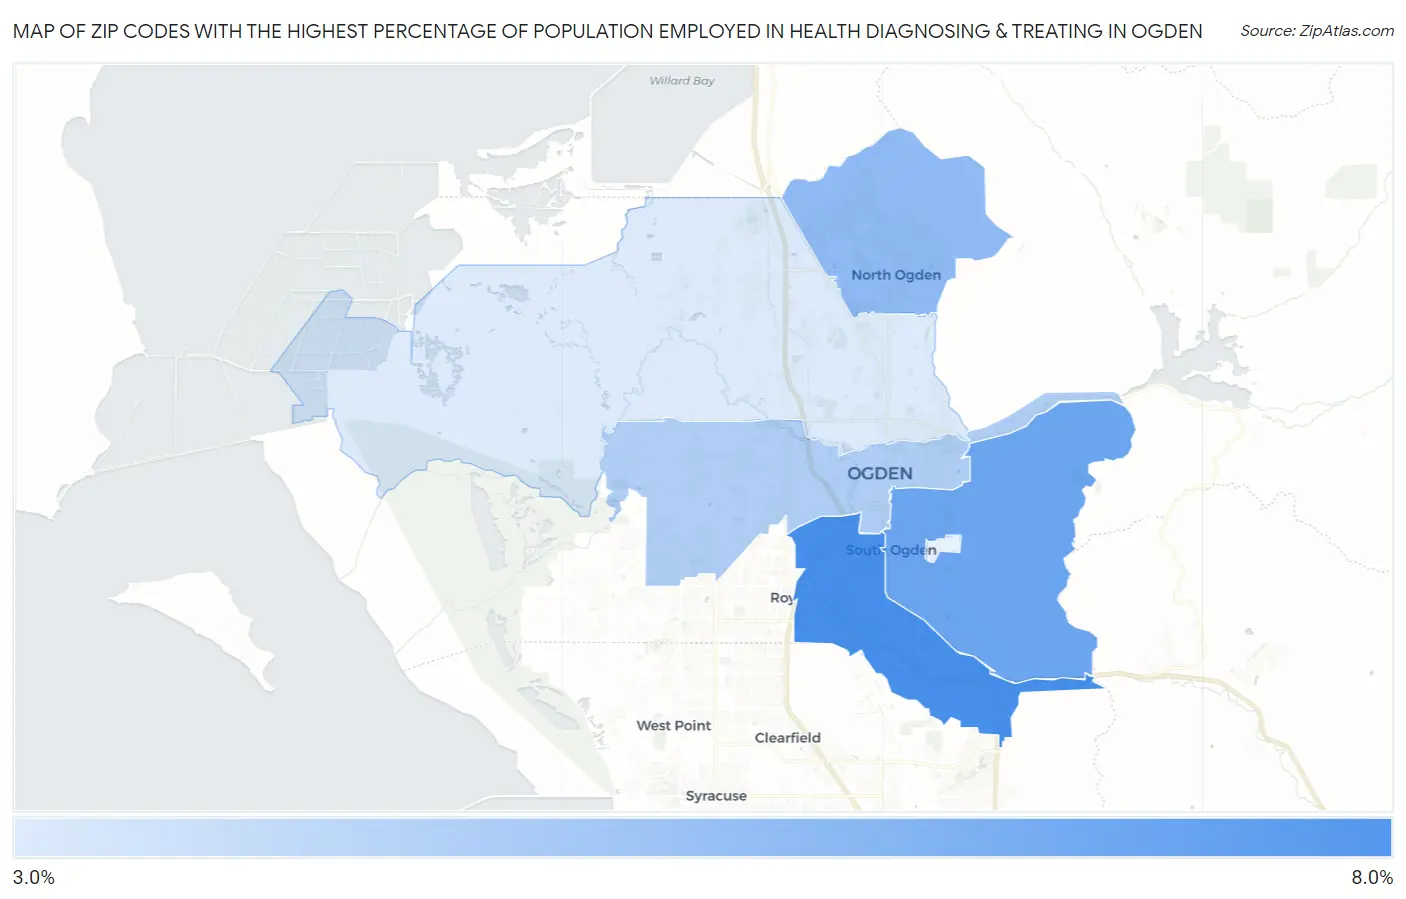
Map of Zip Codes with the Highest Percentage of Population Employed in Health Diagnosing & Treating in Ogden
3.2%
6.7%
Zip Codes with the Highest Percentage of Population Employed in Health Diagnosing & Treating in Ogden, UT
| Zip Code | % Employed | vs State | vs National | |
| 1. | 84405 | 6.7% | 5.1%(+1.53)#59 | 6.2%(+0.412)#11,469 |
| 2. | 84403 | 5.8% | 5.1%(+0.668)#77 | 6.2%(-0.452)#14,631 |
| 3. | 84414 | 5.0% | 5.1%(-0.125)#93 | 6.2%(-1.25)#17,723 |
| 4. | 84401 | 4.3% | 5.1%(-0.871)#125 | 6.2%(-1.99)#20,510 |
| 5. | 84404 | 3.2% | 5.1%(-1.91)#163 | 6.2%(-3.03)#23,739 |
1
Common Questions
What are the Top 5 Zip Codes with the Highest Percentage of Population Employed in Health Diagnosing & Treating in Ogden, UT?
Top 5 Zip Codes with the Highest Percentage of Population Employed in Health Diagnosing & Treating in Ogden, UT are:
What zip code has the Highest Percentage of Population Employed in Health Diagnosing & Treating in Ogden, UT?
84405 has the Highest Percentage of Population Employed in Health Diagnosing & Treating in Ogden, UT with 6.7%.
What is the Percentage of Population Employed in Health Diagnosing & Treating in Ogden, UT?
Percentage of Population Employed in Health Diagnosing & Treating in Ogden is 4.0%.
What is the Percentage of Population Employed in Health Diagnosing & Treating in Utah?
Percentage of Population Employed in Health Diagnosing & Treating in Utah is 5.1%.
What is the Percentage of Population Employed in Health Diagnosing & Treating in the United States?
Percentage of Population Employed in Health Diagnosing & Treating in the United States is 6.2%.