Zip Codes with the Highest Percentage of Population Employed in Community & Social Service in Ogden, UT

RELATED REPORTS & OPTIONS

Community & Social Service
Population
Families and Households
Female Fertility
Female Fertility (Unmarried)
Race (Community Size)
Race (Percentage)
Ancestry (Community Size)
AfricanAmericanApacheArabArgentineanArmenianAustralianAustrianBangladeshiBasqueBelgianBhutaneseBlackfeetBrazilianBritishBurmeseCanadianCentral AmericanCentral American IndianCherokeeChileanChippewaChoctawColombianCosta RicanCreekCroatianCubanCzechCzechoslovakianDanishDominicanDutchEastern EuropeanEcuadorianEnglishEuropeanFijianFilipinoFinnishFrenchFrench CanadianGermanGreekGuamanian / ChamorroGuatemalanHaitianHonduranHungarianIcelanderIndian (Asian)IranianIrishItalianJamaicanJapaneseKoreanLatvianLebaneseLithuanianMalaysianMexicanMexican American IndianNative HawaiianNavajoNigerianNorthern EuropeanNorwegianPakistaniPanamanianPeruvianPolishPortuguesePuebloPuerto RicanRomanianRussianSalvadoranSamoanScandinavianScotch-IrishScottishSerbianShoshoneSiouxSlavicSlovakSloveneSomaliSouth AmericanSouth American IndianSpaniardSpanishSpanish AmericanSpanish American IndianSri LankanSubsaharan AfricanSwedishSwissThaiTonganTrinidadian and TobagonianUkrainianUruguayanUteVenezuelanWelshWest IndianYugoslavian
Ancestry (Percentage)
AfricanAmericanApacheArabArgentineanArmenianAustralianAustrianBangladeshiBasqueBelgianBhutaneseBlackfeetBrazilianBritishBurmeseCanadianCentral AmericanCentral American IndianCherokeeChileanChippewaChoctawColombianCosta RicanCreekCroatianCubanCzechCzechoslovakianDanishDominicanDutchEastern EuropeanEcuadorianEnglishEuropeanFijianFilipinoFinnishFrenchFrench CanadianGermanGreekGuamanian / ChamorroGuatemalanHaitianHonduranHungarianIcelanderIndian (Asian)IranianIrishItalianJamaicanJapaneseKoreanLatvianLebaneseLithuanianMalaysianMexicanMexican American IndianNative HawaiianNavajoNigerianNorthern EuropeanNorwegianPakistaniPanamanianPeruvianPolishPortuguesePuebloPuerto RicanRomanianRussianSalvadoranSamoanScandinavianScotch-IrishScottishSerbianShoshoneSiouxSlavicSlovakSloveneSomaliSouth AmericanSouth American IndianSpaniardSpanishSpanish AmericanSpanish American IndianSri LankanSubsaharan AfricanSwedishSwissThaiTonganTrinidadian and TobagonianUkrainianUruguayanUteVenezuelanWelshWest IndianYugoslavian
Immigrant Origin (Total)
Immigrant Origin (Percentage)
Income
Income (Families)
Income (Households)
Poverty
Poverty (Families)
Unemployment
Employment Occupations
Employment Industries
Employer Class
Commute Time
Commute Means
School Enrollment
Education by Degree Field
Occupancy
Finances
Physical Characteristics
Ogden
Compare Zip Codes
Comparison Subject

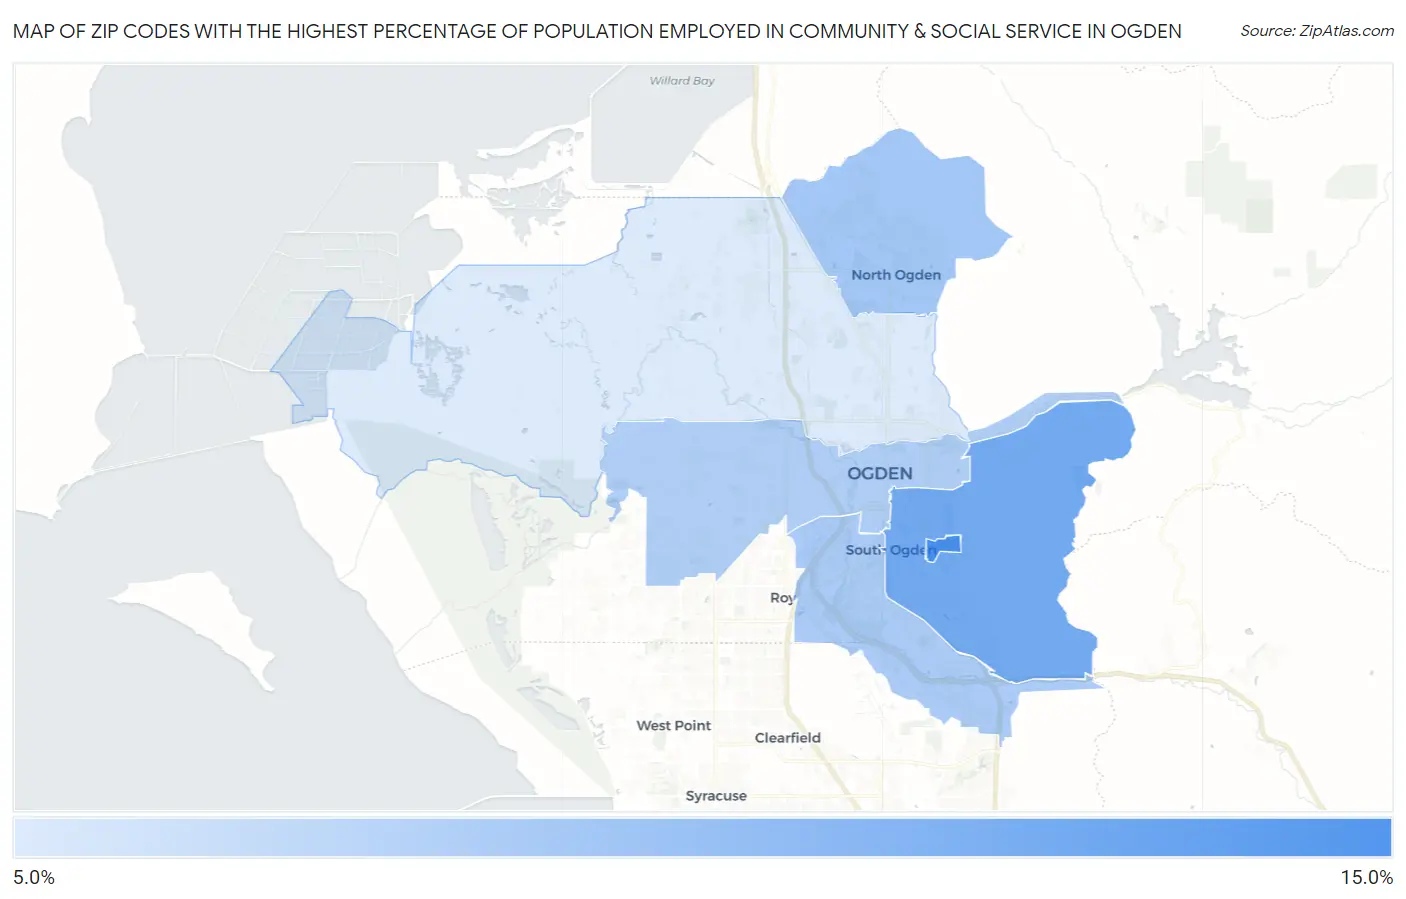
Map of Zip Codes with the Highest Percentage of Population Employed in Community & Social Service in Ogden

0.0%
15.0%
Zip Codes with the Highest Percentage of Population Employed in Community & Social Service  in Ogden Map

Zip Codes with the Highest Percentage of Population Employed in Community & Social Service in Ogden, UT

Zip Code % Employed vs State vs National
1.8440814.3%11.0%(+3.25)#5411.2%(+3.07)#5,733
2.8440312.2%11.0%(+1.12)#9711.2%(+0.941)#9,042
3.844149.8%11.0%(-1.19)#14411.2%(-1.37)#14,544
4.844059.6%11.0%(-1.48)#15011.2%(-1.66)#15,255
5.844019.4%11.0%(-1.67)#15311.2%(-1.85)#15,787
6.844047.2%11.0%(-3.82)#21111.2%(-4.00)#21,602

Common Questions

What are the Top 5 Zip Codes with the Highest Percentage of Population Employed in Community & Social Service in Ogden, UT?
Top 5 Zip Codes with the Highest Percentage of Population Employed in Community & Social Service in Ogden, UT are:
#1
14.3%
#2
12.2%
#3
9.8%
#4
9.6%
#5
9.4%
What zip code has the Highest Percentage of Population Employed in Community & Social Service in Ogden, UT?
84408 has the Highest Percentage of Population Employed in Community & Social Service in Ogden, UT with 14.3%.
What is the Percentage of Population Employed in Community & Social Service in Ogden, UT?
Percentage of Population Employed in Community & Social Service in Ogden is 9.0%.
What is the Percentage of Population Employed in Community & Social Service in Utah?
Percentage of Population Employed in Community & Social Service in Utah is 11.0%.
What is the Percentage of Population Employed in Community & Social Service in the United States?
Percentage of Population Employed in Community & Social Service in the United States is 11.2%.