Zip Codes with the Highest Percentage of Population Employed in Agriculture, Fishing & Hunting in Ogden, UT
RELATED REPORTS & OPTIONS
Agriculture, Fishing & Hunting
Ogden
Compare Zip Codes
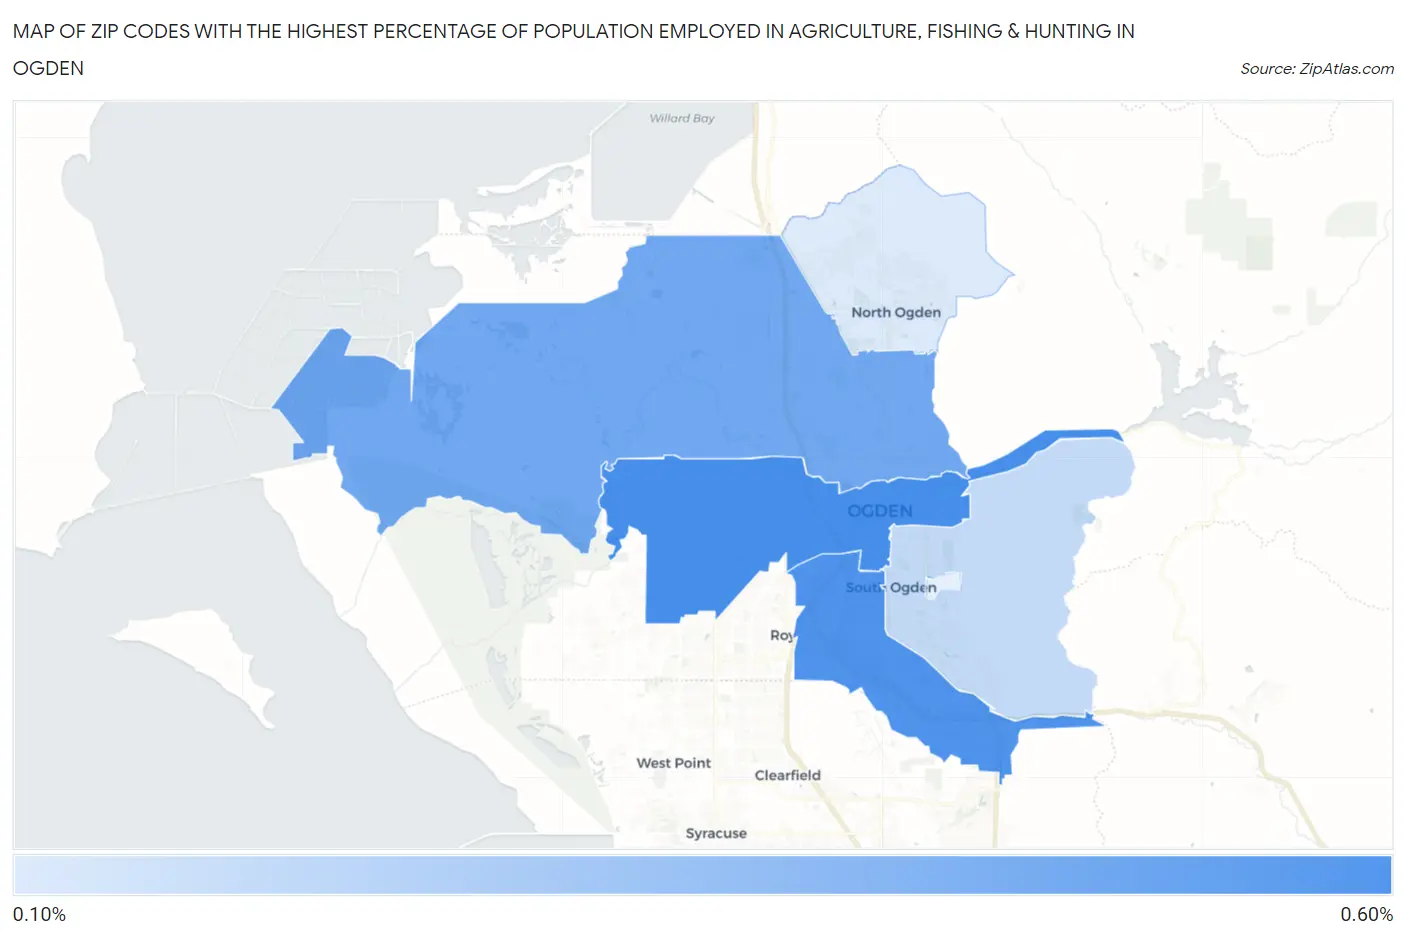
Map of Zip Codes with the Highest Percentage of Population Employed in Agriculture, Fishing & Hunting in Ogden
0.12%
0.55%
Zip Codes with the Highest Percentage of Population Employed in Agriculture, Fishing & Hunting in Ogden, UT
| Zip Code | % Employed | vs State | vs National | |
| 1. | 84401 | 0.55% | 0.72%(-0.177)#160 | 1.2%(-0.654)#18,891 |
| 2. | 84405 | 0.52% | 0.72%(-0.198)#164 | 1.2%(-0.674)#19,060 |
| 3. | 84404 | 0.43% | 0.72%(-0.292)#175 | 1.2%(-0.769)#19,891 |
| 4. | 84403 | 0.20% | 0.72%(-0.526)#209 | 1.2%(-1.00)#22,407 |
| 5. | 84414 | 0.12% | 0.72%(-0.598)#215 | 1.2%(-1.07)#23,345 |
1
Common Questions
What are the Top 5 Zip Codes with the Highest Percentage of Population Employed in Agriculture, Fishing & Hunting in Ogden, UT?
Top 5 Zip Codes with the Highest Percentage of Population Employed in Agriculture, Fishing & Hunting in Ogden, UT are:
What zip code has the Highest Percentage of Population Employed in Agriculture, Fishing & Hunting in Ogden, UT?
84401 has the Highest Percentage of Population Employed in Agriculture, Fishing & Hunting in Ogden, UT with 0.55%.
What is the Percentage of Population Employed in Agriculture, Fishing & Hunting in Ogden, UT?
Percentage of Population Employed in Agriculture, Fishing & Hunting in Ogden is 0.40%.
What is the Percentage of Population Employed in Agriculture, Fishing & Hunting in Utah?
Percentage of Population Employed in Agriculture, Fishing & Hunting in Utah is 0.72%.
What is the Percentage of Population Employed in Agriculture, Fishing & Hunting in the United States?
Percentage of Population Employed in Agriculture, Fishing & Hunting in the United States is 1.2%.