Zip Codes with the Highest Percentage of Population Employed in Accommodation & Food Services in Ogden, UT
RELATED REPORTS & OPTIONS
Accommodation & Food Services
Ogden
Compare Zip Codes
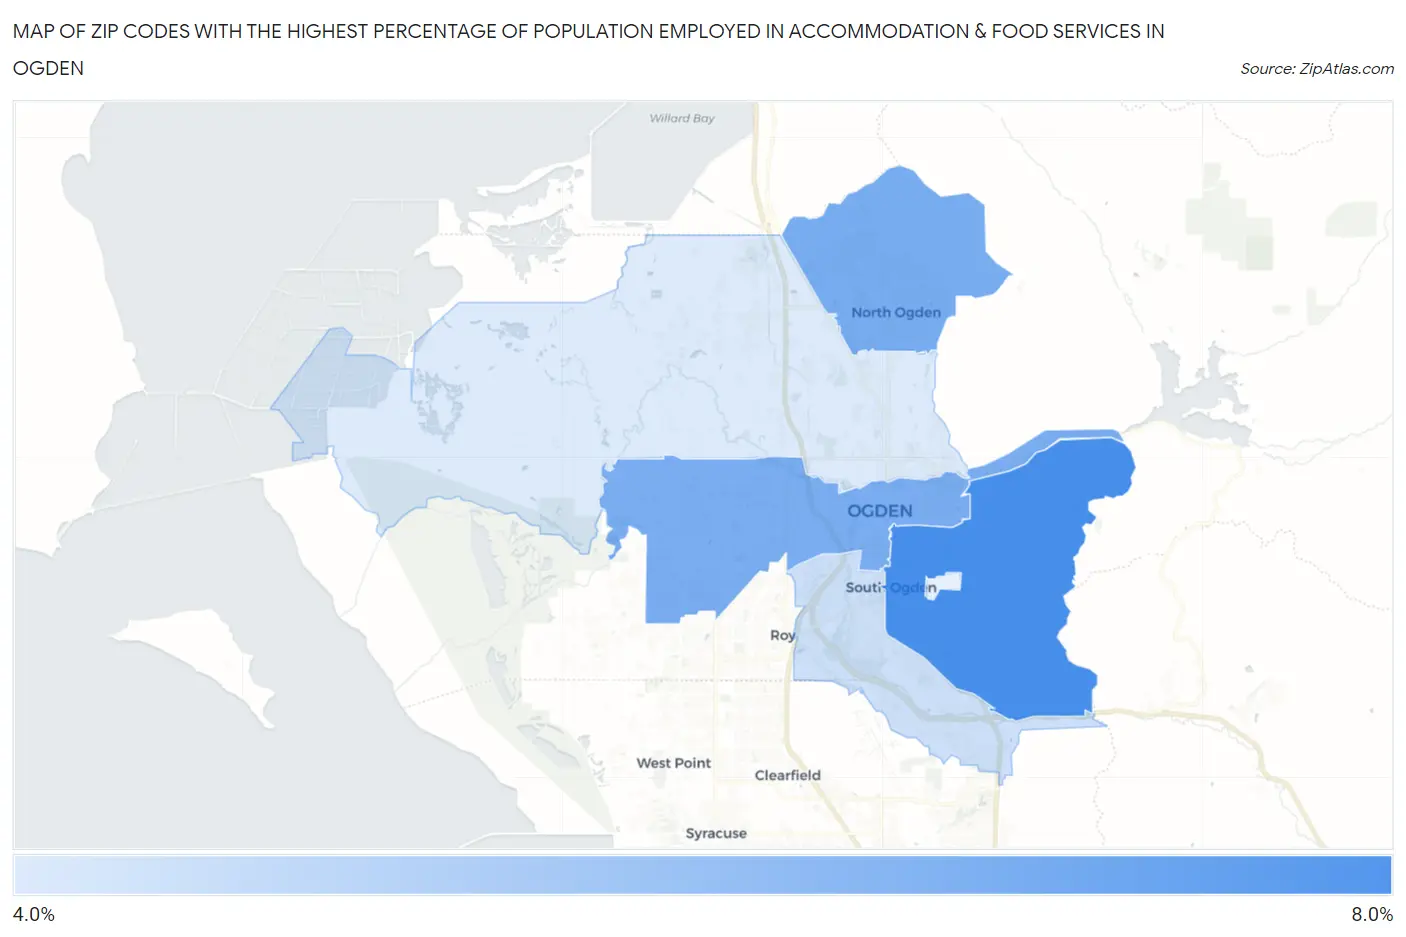
Map of Zip Codes with the Highest Percentage of Population Employed in Accommodation & Food Services in Ogden
4.6%
6.8%
Zip Codes with the Highest Percentage of Population Employed in Accommodation & Food Services in Ogden, UT
| Zip Code | % Employed | vs State | vs National | |
| 1. | 84403 | 6.8% | 6.1%(+0.713)#93 | 6.9%(-0.048)#10,782 |
| 2. | 84414 | 6.1% | 6.1%(-0.026)#112 | 6.9%(-0.788)#13,156 |
| 3. | 84401 | 6.1% | 6.1%(-0.031)#113 | 6.9%(-0.792)#13,177 |
| 4. | 84405 | 4.8% | 6.1%(-1.28)#151 | 6.9%(-2.04)#17,357 |
| 5. | 84404 | 4.6% | 6.1%(-1.51)#160 | 6.9%(-2.27)#18,135 |
1
Common Questions
What are the Top 5 Zip Codes with the Highest Percentage of Population Employed in Accommodation & Food Services in Ogden, UT?
Top 5 Zip Codes with the Highest Percentage of Population Employed in Accommodation & Food Services in Ogden, UT are:
What zip code has the Highest Percentage of Population Employed in Accommodation & Food Services in Ogden, UT?
84403 has the Highest Percentage of Population Employed in Accommodation & Food Services in Ogden, UT with 6.8%.
What is the Percentage of Population Employed in Accommodation & Food Services in Ogden, UT?
Percentage of Population Employed in Accommodation & Food Services in Ogden is 5.7%.
What is the Percentage of Population Employed in Accommodation & Food Services in Utah?
Percentage of Population Employed in Accommodation & Food Services in Utah is 6.1%.
What is the Percentage of Population Employed in Accommodation & Food Services in the United States?
Percentage of Population Employed in Accommodation & Food Services in the United States is 6.9%.