Zip Codes with the Highest Percentage of Population Employed in Accommodation & Food Services in Layton, UT
RELATED REPORTS & OPTIONS
Accommodation & Food Services
Layton
Compare Zip Codes
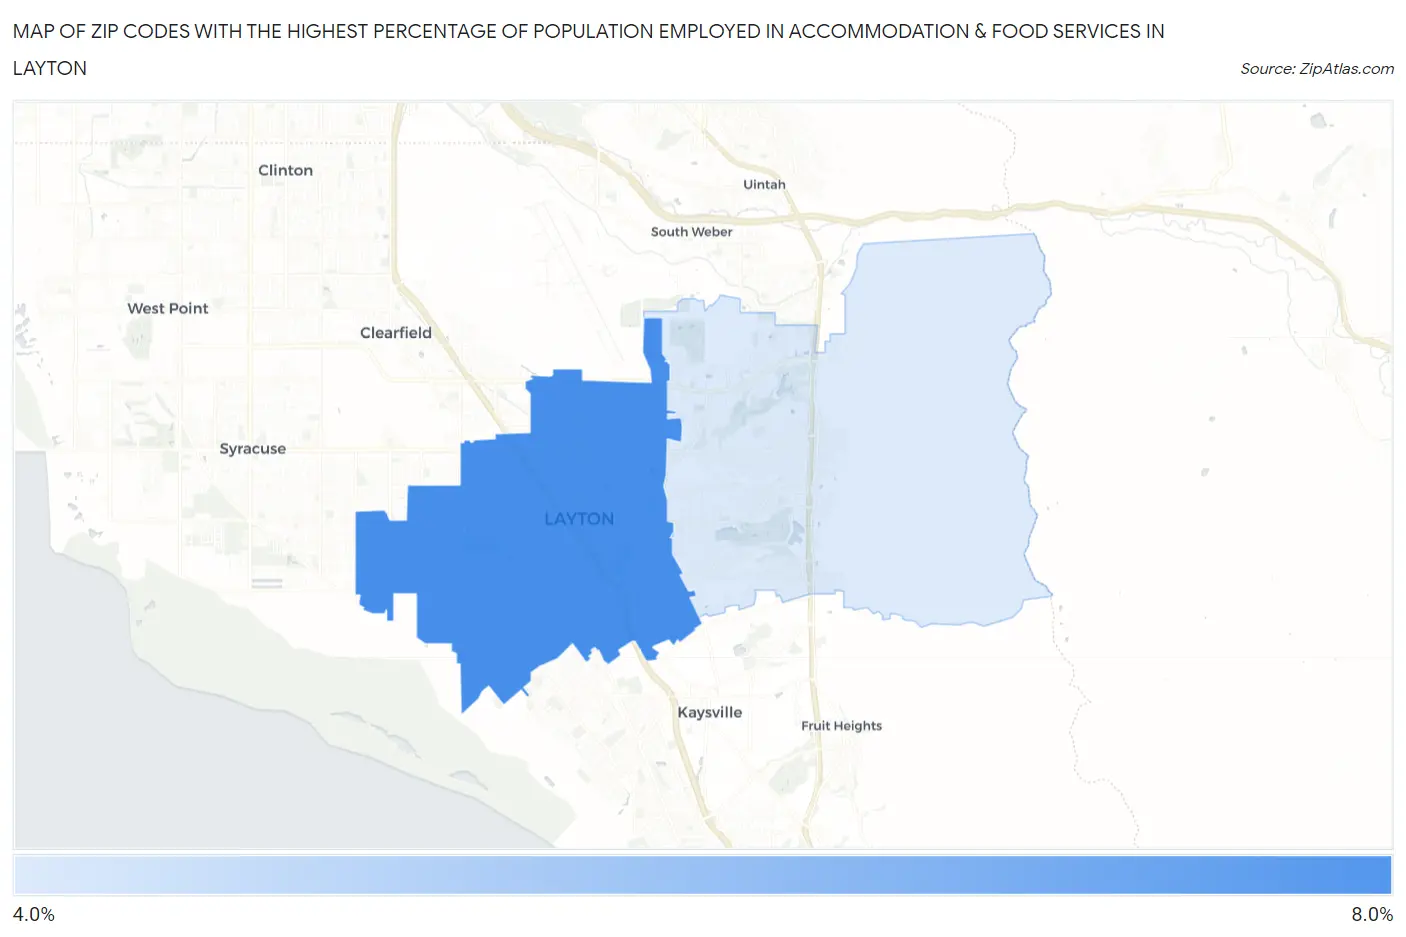
Map of Zip Codes with the Highest Percentage of Population Employed in Accommodation & Food Services in Layton
4.0%
6.6%
Zip Codes with the Highest Percentage of Population Employed in Accommodation & Food Services in Layton, UT
| Zip Code | % Employed | vs State | vs National | |
| 1. | 84041 | 6.6% | 6.1%(+0.507)#98 | 6.9%(-0.254)#11,427 |
| 2. | 84040 | 4.0% | 6.1%(-2.09)#174 | 6.9%(-2.85)#20,054 |
1
Common Questions
What are the Top Zip Codes with the Highest Percentage of Population Employed in Accommodation & Food Services in Layton, UT?
Top Zip Codes with the Highest Percentage of Population Employed in Accommodation & Food Services in Layton, UT are:
What zip code has the Highest Percentage of Population Employed in Accommodation & Food Services in Layton, UT?
84041 has the Highest Percentage of Population Employed in Accommodation & Food Services in Layton, UT with 6.6%.
What is the Percentage of Population Employed in Accommodation & Food Services in Layton, UT?
Percentage of Population Employed in Accommodation & Food Services in Layton is 5.8%.
What is the Percentage of Population Employed in Accommodation & Food Services in Utah?
Percentage of Population Employed in Accommodation & Food Services in Utah is 6.1%.
What is the Percentage of Population Employed in Accommodation & Food Services in the United States?
Percentage of Population Employed in Accommodation & Food Services in the United States is 6.9%.