Zip Codes with the Highest Percentage of Population Employed in Accommodation & Food Services in West Jordan, UT
RELATED REPORTS & OPTIONS
Accommodation & Food Services
West Jordan
Compare Zip Codes
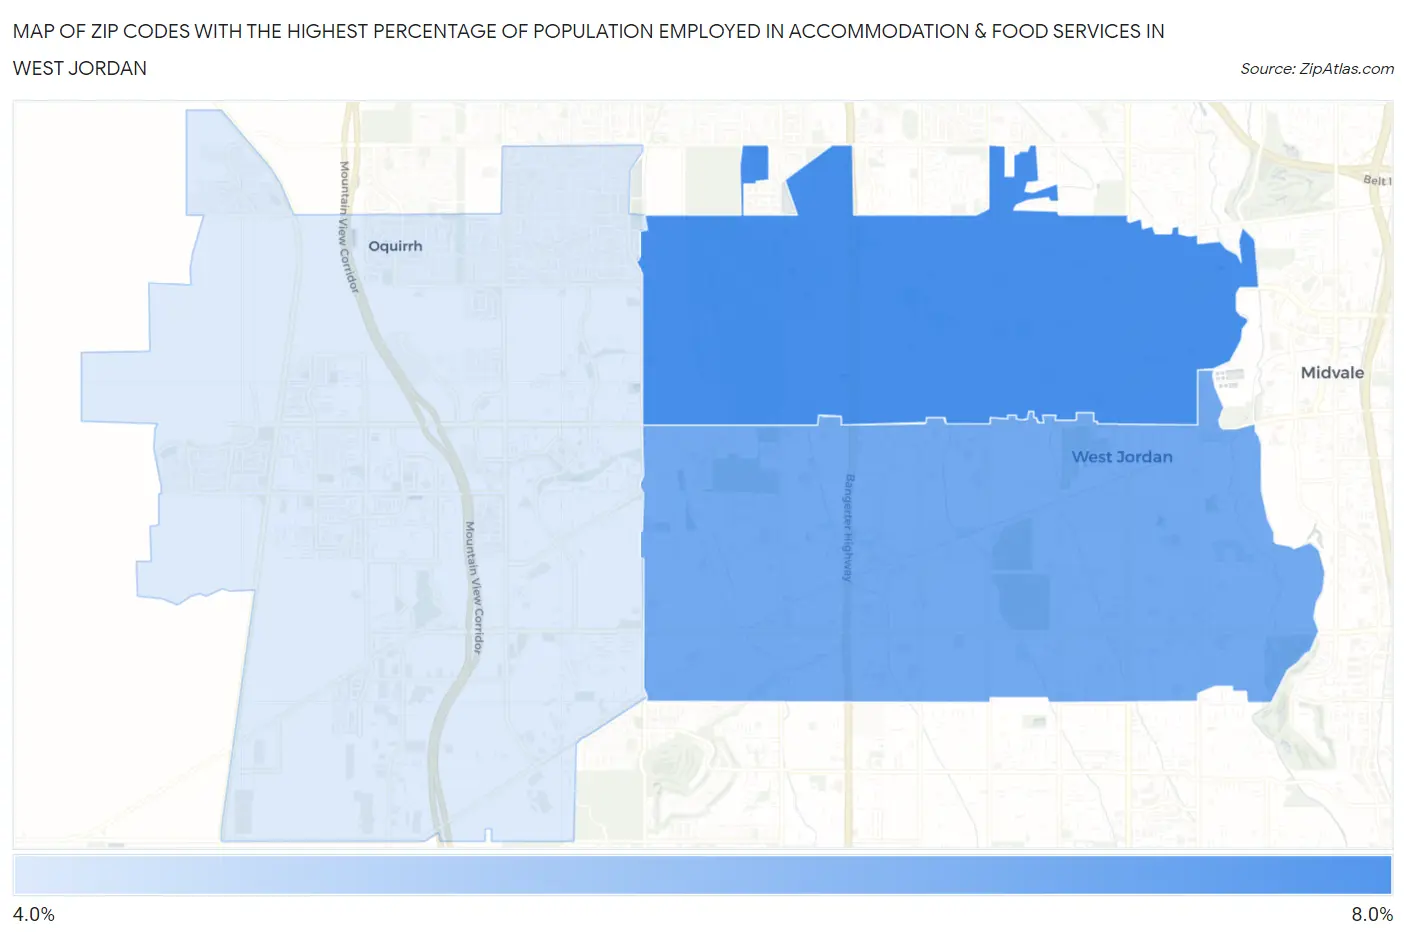
Map of Zip Codes with the Highest Percentage of Population Employed in Accommodation & Food Services in West Jordan
4.4%
6.4%
Zip Codes with the Highest Percentage of Population Employed in Accommodation & Food Services in West Jordan, UT
| Zip Code | % Employed | vs State | vs National | |
| 1. | 84084 | 6.4% | 6.1%(+0.327)#104 | 6.9%(-0.434)#12,008 |
| 2. | 84088 | 5.9% | 6.1%(-0.255)#121 | 6.9%(-1.02)#13,900 |
| 3. | 84081 | 4.4% | 6.1%(-1.68)#165 | 6.9%(-2.44)#18,701 |
1
Common Questions
What are the Top Zip Codes with the Highest Percentage of Population Employed in Accommodation & Food Services in West Jordan, UT?
Top Zip Codes with the Highest Percentage of Population Employed in Accommodation & Food Services in West Jordan, UT are:
What zip code has the Highest Percentage of Population Employed in Accommodation & Food Services in West Jordan, UT?
84084 has the Highest Percentage of Population Employed in Accommodation & Food Services in West Jordan, UT with 6.4%.
What is the Percentage of Population Employed in Accommodation & Food Services in West Jordan, UT?
Percentage of Population Employed in Accommodation & Food Services in West Jordan is 5.5%.
What is the Percentage of Population Employed in Accommodation & Food Services in Utah?
Percentage of Population Employed in Accommodation & Food Services in Utah is 6.1%.
What is the Percentage of Population Employed in Accommodation & Food Services in the United States?
Percentage of Population Employed in Accommodation & Food Services in the United States is 6.9%.