Zip Codes with the Highest Percentage of Population Employed in Agriculture, Fishing & Hunting in Cedar City, UT
RELATED REPORTS & OPTIONS
Agriculture, Fishing & Hunting
Cedar City
Compare Zip Codes
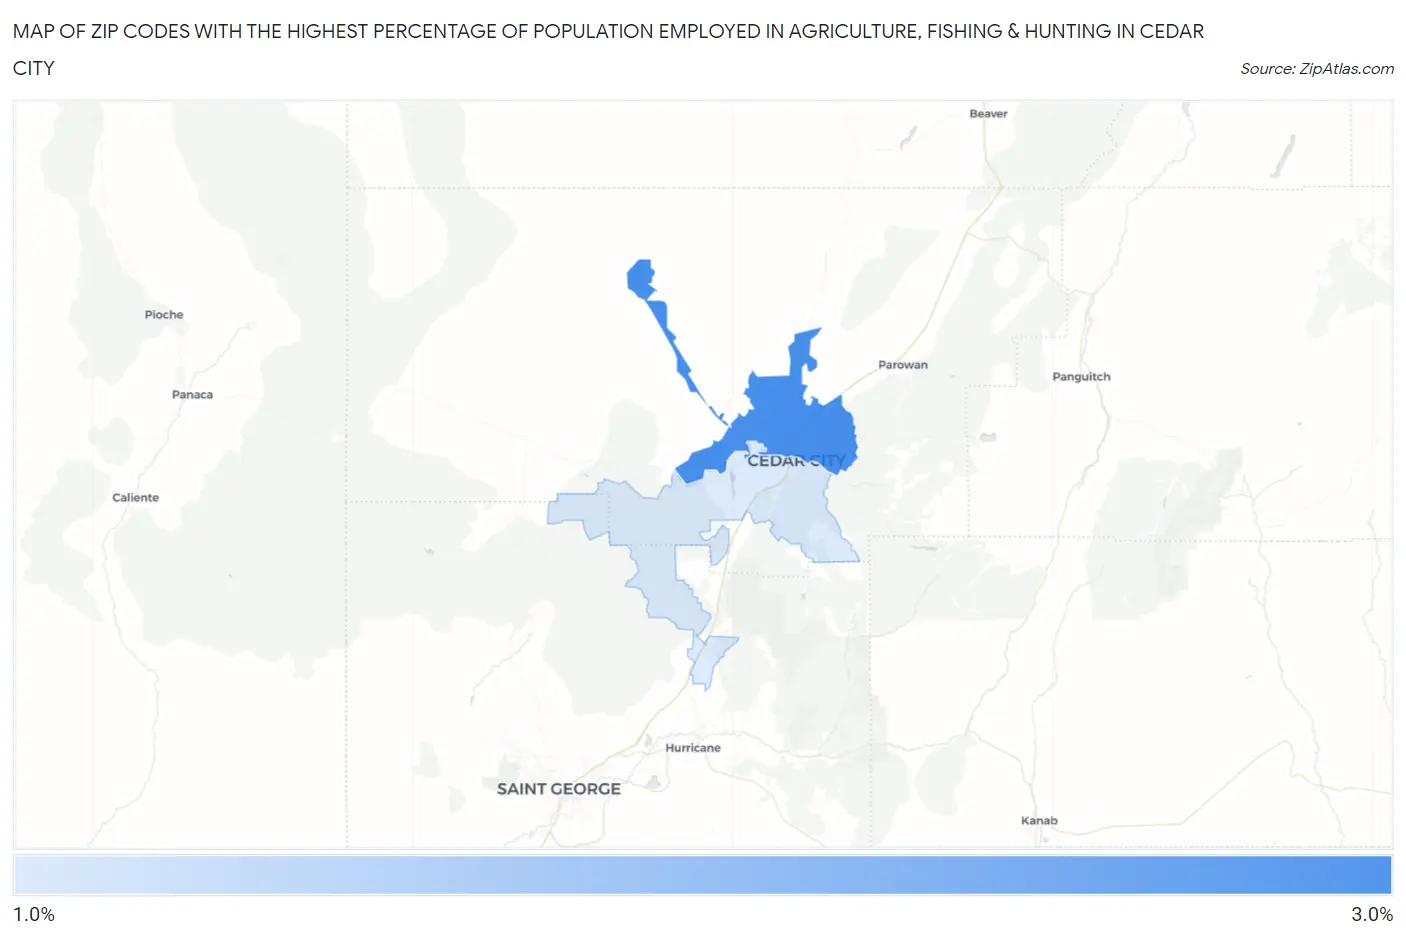
Map of Zip Codes with the Highest Percentage of Population Employed in Agriculture, Fishing & Hunting in Cedar City
1.6%
2.9%
Zip Codes with the Highest Percentage of Population Employed in Agriculture, Fishing & Hunting in Cedar City, UT
| Zip Code | % Employed | vs State | vs National | |
| 1. | 84721 | 2.9% | 0.72%(+2.19)#92 | 1.2%(+1.72)#10,731 |
| 2. | 84720 | 1.6% | 0.72%(+0.879)#119 | 1.2%(+0.402)#13,966 |
1
Common Questions
What are the Top Zip Codes with the Highest Percentage of Population Employed in Agriculture, Fishing & Hunting in Cedar City, UT?
Top Zip Codes with the Highest Percentage of Population Employed in Agriculture, Fishing & Hunting in Cedar City, UT are:
What zip code has the Highest Percentage of Population Employed in Agriculture, Fishing & Hunting in Cedar City, UT?
84721 has the Highest Percentage of Population Employed in Agriculture, Fishing & Hunting in Cedar City, UT with 2.9%.
What is the Percentage of Population Employed in Agriculture, Fishing & Hunting in Cedar City, UT?
Percentage of Population Employed in Agriculture, Fishing & Hunting in Cedar City is 1.4%.
What is the Percentage of Population Employed in Agriculture, Fishing & Hunting in Utah?
Percentage of Population Employed in Agriculture, Fishing & Hunting in Utah is 0.72%.
What is the Percentage of Population Employed in Agriculture, Fishing & Hunting in the United States?
Percentage of Population Employed in Agriculture, Fishing & Hunting in the United States is 1.2%.