Zimbabwean vs Japanese Unemployment Among Women with Children Under 6 years
COMPARE
Zimbabwean
Japanese
Unemployment Among Women with Children Under 6 years
Unemployment Among Women with Children Under 6 years Comparison
Zimbabweans
Japanese
7.3%
UNEMPLOYMENT AMONG WOMEN WITH CHILDREN UNDER 6 YEARS
91.5/ 100
METRIC RATING
128th/ 347
METRIC RANK
7.5%
UNEMPLOYMENT AMONG WOMEN WITH CHILDREN UNDER 6 YEARS
78.9/ 100
METRIC RATING
146th/ 347
METRIC RANK
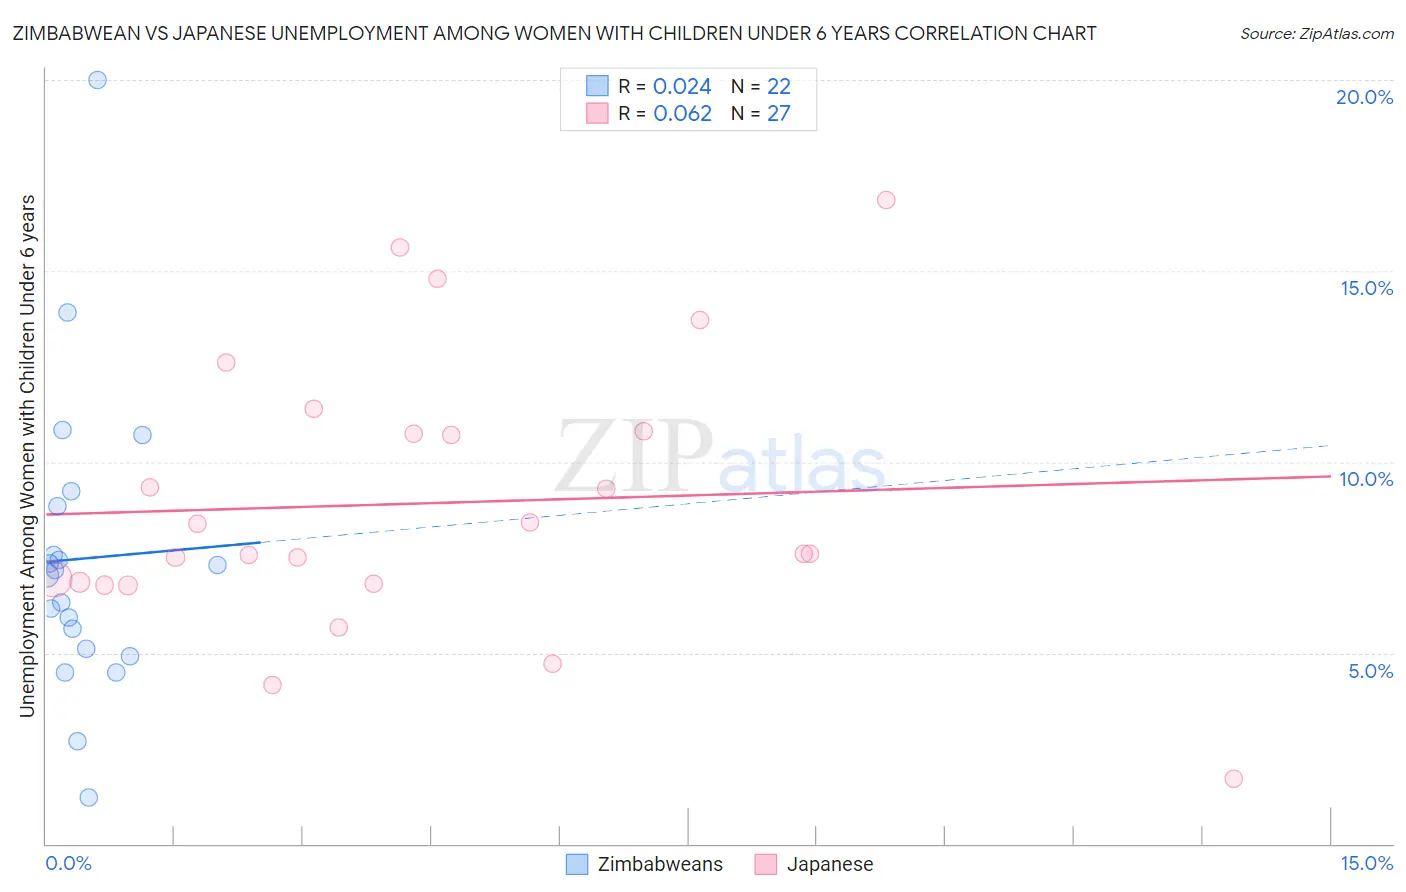
Zimbabwean vs Japanese Unemployment Among Women with Children Under 6 years Correlation Chart
The statistical analysis conducted on geographies consisting of 63,906,622 people shows no correlation between the proportion of Zimbabweans and unemployment rate among women with children under the age of 6 in the United States with a correlation coefficient (R) of 0.024 and weighted average of 7.3%. Similarly, the statistical analysis conducted on geographies consisting of 210,271,633 people shows a slight positive correlation between the proportion of Japanese and unemployment rate among women with children under the age of 6 in the United States with a correlation coefficient (R) of 0.062 and weighted average of 7.5%, a difference of 1.8%.
Unemployment Among Women with Children Under 6 years Correlation Summary
| Measurement | Zimbabwean | Japanese |
| Minimum | 1.2% | 1.7% |
| Maximum | 20.0% | 16.9% |
| Range | 18.8% | 15.2% |
| Mean | 7.5% | 8.9% |
| Median | 7.1% | 7.6% |
| Interquartile 25% (IQ1) | 5.1% | 6.8% |
| Interquartile 75% (IQ3) | 8.9% | 10.8% |
| Interquartile Range (IQR) | 3.7% | 4.0% |
| Standard Deviation (Sample) | 3.9% | 3.6% |
| Standard Deviation (Population) | 3.9% | 3.5% |
Demographics Similar to Zimbabweans and Japanese by Unemployment Among Women with Children Under 6 years
In terms of unemployment among women with children under 6 years, the demographic groups most similar to Zimbabweans are Jordanian (7.3%, a difference of 0.0%), Slovene (7.4%, a difference of 0.45%), Swedish (7.4%, a difference of 0.59%), Ukrainian (7.4%, a difference of 0.62%), and Immigrants from Armenia (7.4%, a difference of 0.75%). Similarly, the demographic groups most similar to Japanese are Immigrants from Jordan (7.5%, a difference of 0.0%), European (7.5%, a difference of 0.030%), Immigrants from Oceania (7.5%, a difference of 0.050%), Korean (7.5%, a difference of 0.26%), and Immigrants from Argentina (7.5%, a difference of 0.28%).
| Demographics | Rating | Rank | Unemployment Among Women with Children Under 6 years |
| Jordanians | 91.5 /100 | #127 | Exceptional 7.3% |
| Zimbabweans | 91.5 /100 | #128 | Exceptional 7.3% |
| Slovenes | 89.2 /100 | #129 | Excellent 7.4% |
| Swedes | 88.4 /100 | #130 | Excellent 7.4% |
| Ukrainians | 88.2 /100 | #131 | Excellent 7.4% |
| Immigrants | Armenia | 87.4 /100 | #132 | Excellent 7.4% |
| Immigrants | Uganda | 86.5 /100 | #133 | Excellent 7.4% |
| Immigrants | Bolivia | 85.7 /100 | #134 | Excellent 7.4% |
| Immigrants | Northern Africa | 85.3 /100 | #135 | Excellent 7.4% |
| Immigrants | Morocco | 84.9 /100 | #136 | Excellent 7.4% |
| Immigrants | Cambodia | 84.6 /100 | #137 | Excellent 7.4% |
| Immigrants | Norway | 84.1 /100 | #138 | Excellent 7.4% |
| Immigrants | Colombia | 83.9 /100 | #139 | Excellent 7.4% |
| Scandinavians | 83.0 /100 | #140 | Excellent 7.4% |
| Greeks | 82.6 /100 | #141 | Excellent 7.4% |
| Immigrants | Argentina | 81.5 /100 | #142 | Excellent 7.5% |
| Koreans | 81.3 /100 | #143 | Excellent 7.5% |
| Europeans | 79.1 /100 | #144 | Good 7.5% |
| Immigrants | Jordan | 78.9 /100 | #145 | Good 7.5% |
| Japanese | 78.9 /100 | #146 | Good 7.5% |
| Immigrants | Oceania | 78.4 /100 | #147 | Good 7.5% |