Zimbabwean vs Immigrants from Norway Unemployment Among Ages 35 to 44 years
COMPARE
Zimbabwean
Immigrants from Norway
Unemployment Among Ages 35 to 44 years
Unemployment Among Ages 35 to 44 years Comparison
Zimbabweans
Immigrants from Norway
4.3%
UNEMPLOYMENT AMONG AGES 35 TO 44 YEARS
98.8/ 100
METRIC RATING
40th/ 347
METRIC RANK
4.6%
UNEMPLOYMENT AMONG AGES 35 TO 44 YEARS
77.5/ 100
METRIC RATING
138th/ 347
METRIC RANK
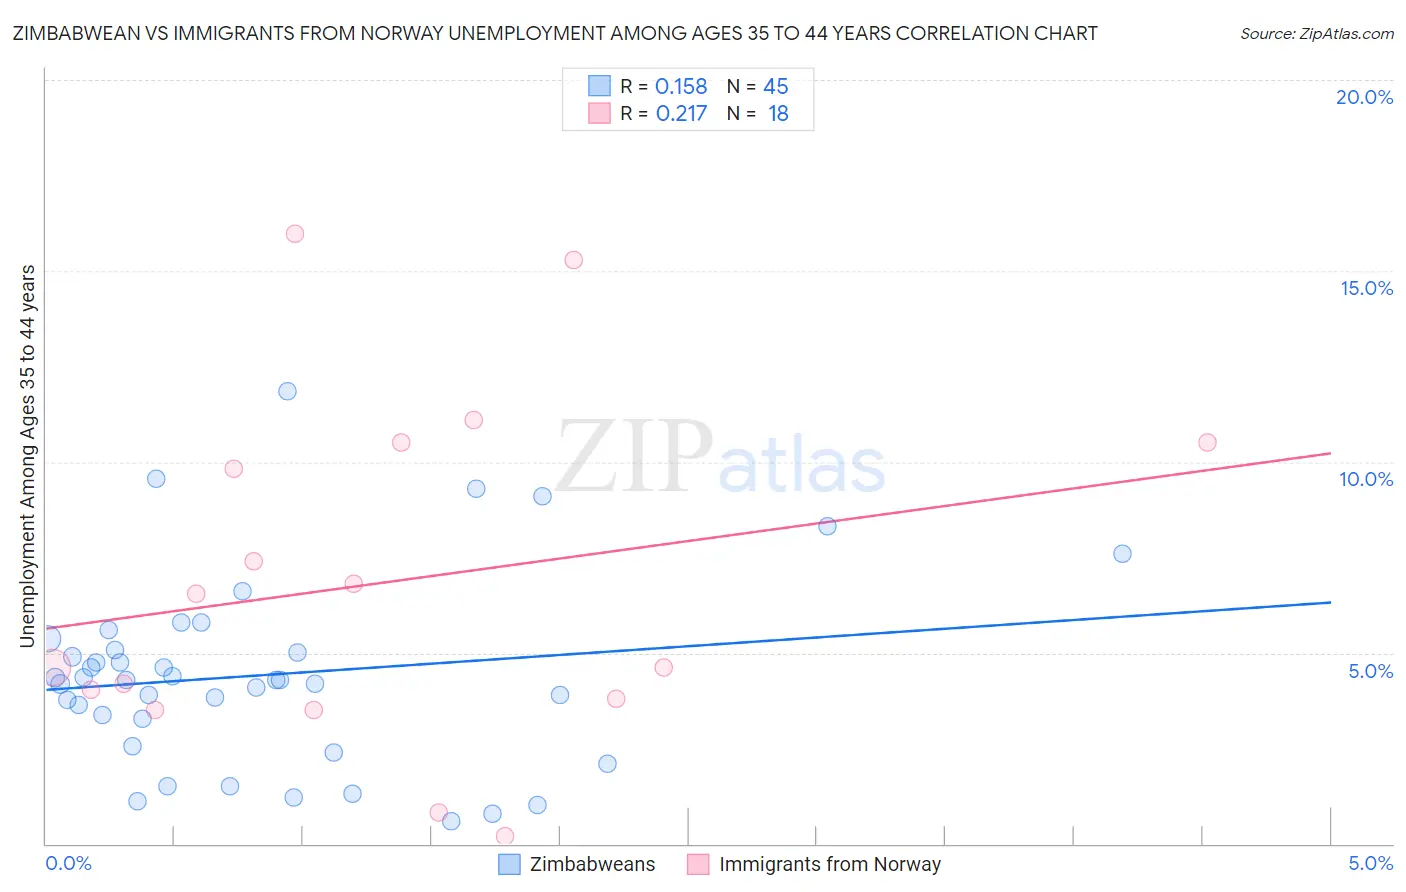
Zimbabwean vs Immigrants from Norway Unemployment Among Ages 35 to 44 years Correlation Chart
The statistical analysis conducted on geographies consisting of 68,932,734 people shows a poor positive correlation between the proportion of Zimbabweans and unemployment rate among population between the ages 35 and 44 in the United States with a correlation coefficient (R) of 0.158 and weighted average of 4.3%. Similarly, the statistical analysis conducted on geographies consisting of 115,659,924 people shows a weak positive correlation between the proportion of Immigrants from Norway and unemployment rate among population between the ages 35 and 44 in the United States with a correlation coefficient (R) of 0.217 and weighted average of 4.6%, a difference of 6.1%.
Unemployment Among Ages 35 to 44 years Correlation Summary
| Measurement | Zimbabwean | Immigrants from Norway |
| Minimum | 0.60% | 0.20% |
| Maximum | 11.9% | 16.0% |
| Range | 11.3% | 15.8% |
| Mean | 4.4% | 6.8% |
| Median | 4.3% | 5.6% |
| Interquartile 25% (IQ1) | 2.9% | 3.8% |
| Interquartile 75% (IQ3) | 5.2% | 10.5% |
| Interquartile Range (IQR) | 2.3% | 6.7% |
| Standard Deviation (Sample) | 2.5% | 4.5% |
| Standard Deviation (Population) | 2.4% | 4.4% |
Similar Demographics by Unemployment Among Ages 35 to 44 years
Demographics Similar to Zimbabweans by Unemployment Among Ages 35 to 44 years
In terms of unemployment among ages 35 to 44 years, the demographic groups most similar to Zimbabweans are Palestinian (4.3%, a difference of 0.060%), Belgian (4.3%, a difference of 0.10%), Burmese (4.3%, a difference of 0.11%), German (4.3%, a difference of 0.11%), and Immigrants from Zimbabwe (4.3%, a difference of 0.18%).
| Demographics | Rating | Rank | Unemployment Among Ages 35 to 44 years |
| Immigrants | Sri Lanka | 99.1 /100 | #33 | Exceptional 4.3% |
| Jordanians | 99.0 /100 | #34 | Exceptional 4.3% |
| Luxembourgers | 99.0 /100 | #35 | Exceptional 4.3% |
| Mongolians | 98.9 /100 | #36 | Exceptional 4.3% |
| Immigrants | Zimbabwe | 98.9 /100 | #37 | Exceptional 4.3% |
| Burmese | 98.9 /100 | #38 | Exceptional 4.3% |
| Palestinians | 98.8 /100 | #39 | Exceptional 4.3% |
| Zimbabweans | 98.8 /100 | #40 | Exceptional 4.3% |
| Belgians | 98.7 /100 | #41 | Exceptional 4.3% |
| Germans | 98.7 /100 | #42 | Exceptional 4.3% |
| Eastern Europeans | 98.7 /100 | #43 | Exceptional 4.3% |
| Immigrants | Malaysia | 98.7 /100 | #44 | Exceptional 4.3% |
| Immigrants | Korea | 98.4 /100 | #45 | Exceptional 4.3% |
| Immigrants | Belgium | 98.4 /100 | #46 | Exceptional 4.3% |
| British | 98.3 /100 | #47 | Exceptional 4.4% |
Demographics Similar to Immigrants from Norway by Unemployment Among Ages 35 to 44 years
In terms of unemployment among ages 35 to 44 years, the demographic groups most similar to Immigrants from Norway are Immigrants from Hungary (4.6%, a difference of 0.12%), Immigrants from Iraq (4.6%, a difference of 0.15%), Immigrants from Eastern Africa (4.6%, a difference of 0.15%), Canadian (4.6%, a difference of 0.16%), and Ukrainian (4.6%, a difference of 0.17%).
| Demographics | Rating | Rank | Unemployment Among Ages 35 to 44 years |
| Immigrants | Colombia | 82.6 /100 | #131 | Excellent 4.6% |
| Colombians | 80.8 /100 | #132 | Excellent 4.6% |
| Syrians | 80.7 /100 | #133 | Excellent 4.6% |
| Laotians | 80.1 /100 | #134 | Excellent 4.6% |
| Immigrants | Europe | 79.4 /100 | #135 | Good 4.6% |
| Scotch-Irish | 79.3 /100 | #136 | Good 4.6% |
| Immigrants | Iraq | 78.9 /100 | #137 | Good 4.6% |
| Immigrants | Norway | 77.5 /100 | #138 | Good 4.6% |
| Immigrants | Hungary | 76.3 /100 | #139 | Good 4.6% |
| Immigrants | Eastern Africa | 76.0 /100 | #140 | Good 4.6% |
| Canadians | 75.9 /100 | #141 | Good 4.6% |
| Ukrainians | 75.8 /100 | #142 | Good 4.6% |
| Immigrants | Switzerland | 75.5 /100 | #143 | Good 4.6% |
| Immigrants | Russia | 75.4 /100 | #144 | Good 4.6% |
| Immigrants | Eastern Europe | 74.7 /100 | #145 | Good 4.6% |