Zimbabwean vs Immigrants from Dominican Republic Unemployment Among Seniors over 75 years
COMPARE
Zimbabwean
Immigrants from Dominican Republic
Unemployment Among Seniors over 75 years
Unemployment Among Seniors over 75 years Comparison
Zimbabweans
Immigrants from Dominican Republic
8.7%
UNEMPLOYMENT AMONG SENIORS OVER 75 YEARS
54.1/ 100
METRIC RATING
170th/ 347
METRIC RANK
8.7%
UNEMPLOYMENT AMONG SENIORS OVER 75 YEARS
61.4/ 100
METRIC RATING
165th/ 347
METRIC RANK
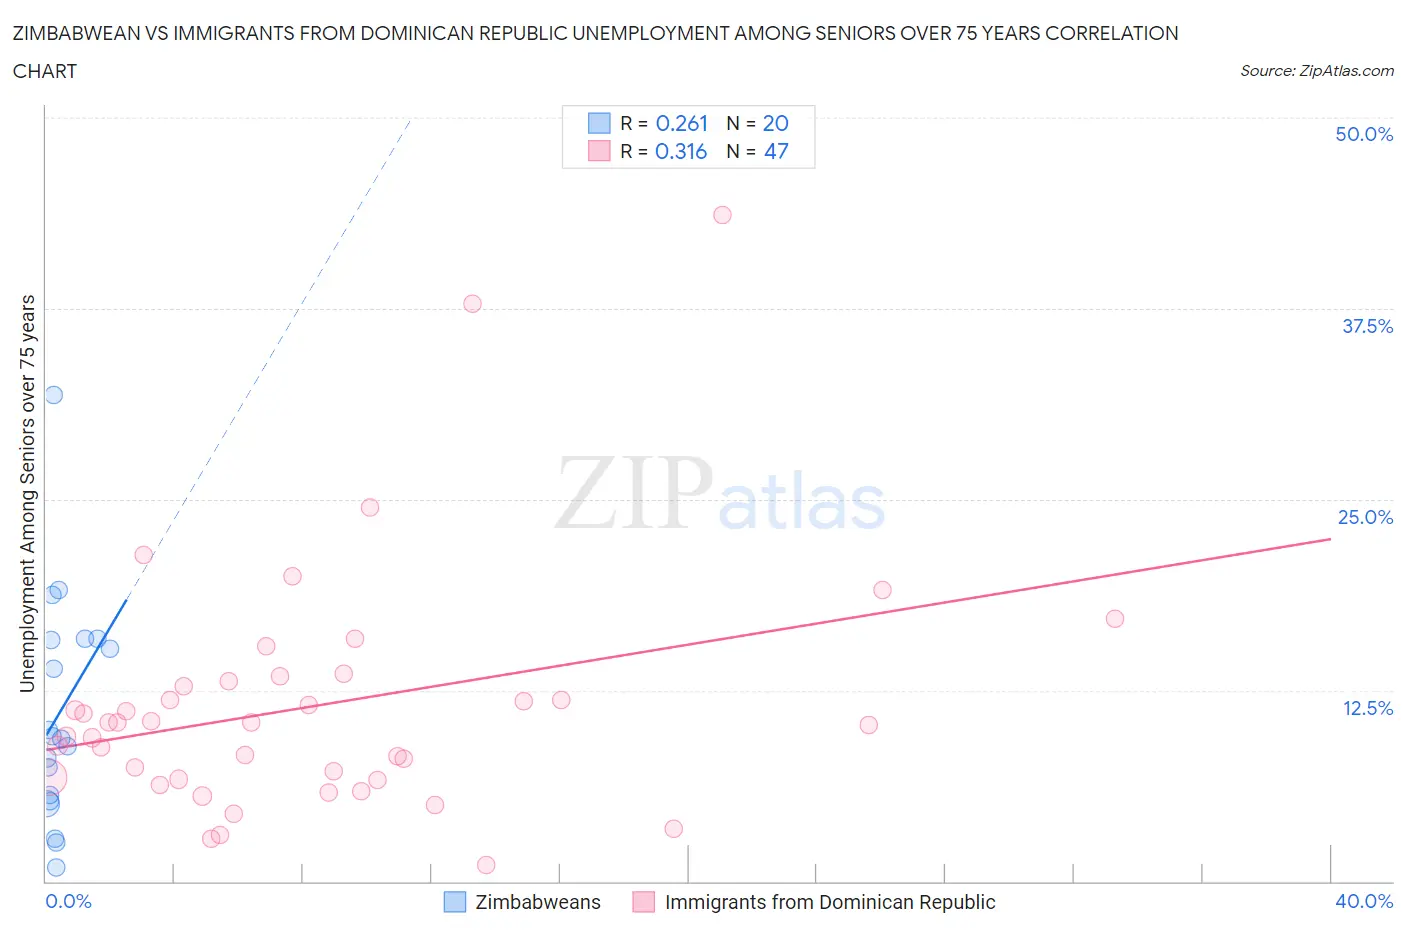
Zimbabwean vs Immigrants from Dominican Republic Unemployment Among Seniors over 75 years Correlation Chart
The statistical analysis conducted on geographies consisting of 56,538,105 people shows a weak positive correlation between the proportion of Zimbabweans and unemployment rate among seniors over the age of 75 in the United States with a correlation coefficient (R) of 0.261 and weighted average of 8.7%. Similarly, the statistical analysis conducted on geographies consisting of 153,666,367 people shows a mild positive correlation between the proportion of Immigrants from Dominican Republic and unemployment rate among seniors over the age of 75 in the United States with a correlation coefficient (R) of 0.316 and weighted average of 8.7%, a difference of 0.41%.
Unemployment Among Seniors over 75 years Correlation Summary
| Measurement | Zimbabwean | Immigrants from Dominican Republic |
| Minimum | 0.90% | 1.1% |
| Maximum | 31.8% | 43.6% |
| Range | 30.9% | 42.5% |
| Mean | 11.1% | 11.5% |
| Median | 9.4% | 10.4% |
| Interquartile 25% (IQ1) | 5.4% | 6.7% |
| Interquartile 75% (IQ3) | 15.8% | 13.1% |
| Interquartile Range (IQR) | 10.4% | 6.5% |
| Standard Deviation (Sample) | 7.4% | 7.9% |
| Standard Deviation (Population) | 7.2% | 7.9% |
Demographics Similar to Zimbabweans and Immigrants from Dominican Republic by Unemployment Among Seniors over 75 years
In terms of unemployment among seniors over 75 years, the demographic groups most similar to Zimbabweans are Dominican (8.7%, a difference of 0.12%), Immigrants (8.7%, a difference of 0.12%), Fijian (8.7%, a difference of 0.13%), Immigrants from Lithuania (8.7%, a difference of 0.17%), and Immigrants from Belize (8.7%, a difference of 0.19%). Similarly, the demographic groups most similar to Immigrants from Dominican Republic are Paraguayan (8.7%, a difference of 0.040%), Immigrants from Belize (8.7%, a difference of 0.21%), Immigrants from Eastern Africa (8.7%, a difference of 0.21%), Immigrants from Lithuania (8.7%, a difference of 0.24%), and Fijian (8.7%, a difference of 0.28%).
| Demographics | Rating | Rank | Unemployment Among Seniors over 75 years |
| Turks | 76.4 /100 | #157 | Good 8.6% |
| Ethiopians | 75.3 /100 | #158 | Good 8.6% |
| Shoshone | 74.6 /100 | #159 | Good 8.6% |
| Cree | 72.8 /100 | #160 | Good 8.6% |
| Albanians | 72.8 /100 | #161 | Good 8.6% |
| Immigrants | South America | 71.3 /100 | #162 | Good 8.6% |
| Immigrants | Guatemala | 68.4 /100 | #163 | Good 8.7% |
| Paraguayans | 62.2 /100 | #164 | Good 8.7% |
| Immigrants | Dominican Republic | 61.4 /100 | #165 | Good 8.7% |
| Immigrants | Belize | 57.6 /100 | #166 | Average 8.7% |
| Immigrants | Eastern Africa | 57.6 /100 | #167 | Average 8.7% |
| Immigrants | Lithuania | 57.2 /100 | #168 | Average 8.7% |
| Fijians | 56.4 /100 | #169 | Average 8.7% |
| Zimbabweans | 54.1 /100 | #170 | Average 8.7% |
| Dominicans | 51.9 /100 | #171 | Average 8.7% |
| Immigrants | Immigrants | 51.8 /100 | #172 | Average 8.7% |
| Australians | 50.3 /100 | #173 | Average 8.7% |
| Immigrants | El Salvador | 49.7 /100 | #174 | Average 8.7% |
| Syrians | 49.6 /100 | #175 | Average 8.7% |
| Somalis | 45.3 /100 | #176 | Average 8.8% |
| Central Americans | 43.3 /100 | #177 | Average 8.8% |