Zimbabwean vs Hmong Unemployment Among Seniors over 65 years
COMPARE
Zimbabwean
Hmong
Unemployment Among Seniors over 65 years
Unemployment Among Seniors over 65 years Comparison
Zimbabweans
Hmong
5.6%
UNEMPLOYMENT AMONG SENIORS OVER 65 YEARS
0.0/ 100
METRIC RATING
300th/ 347
METRIC RANK
4.2%
UNEMPLOYMENT AMONG SENIORS OVER 65 YEARS
100.0/ 100
METRIC RATING
2nd/ 347
METRIC RANK
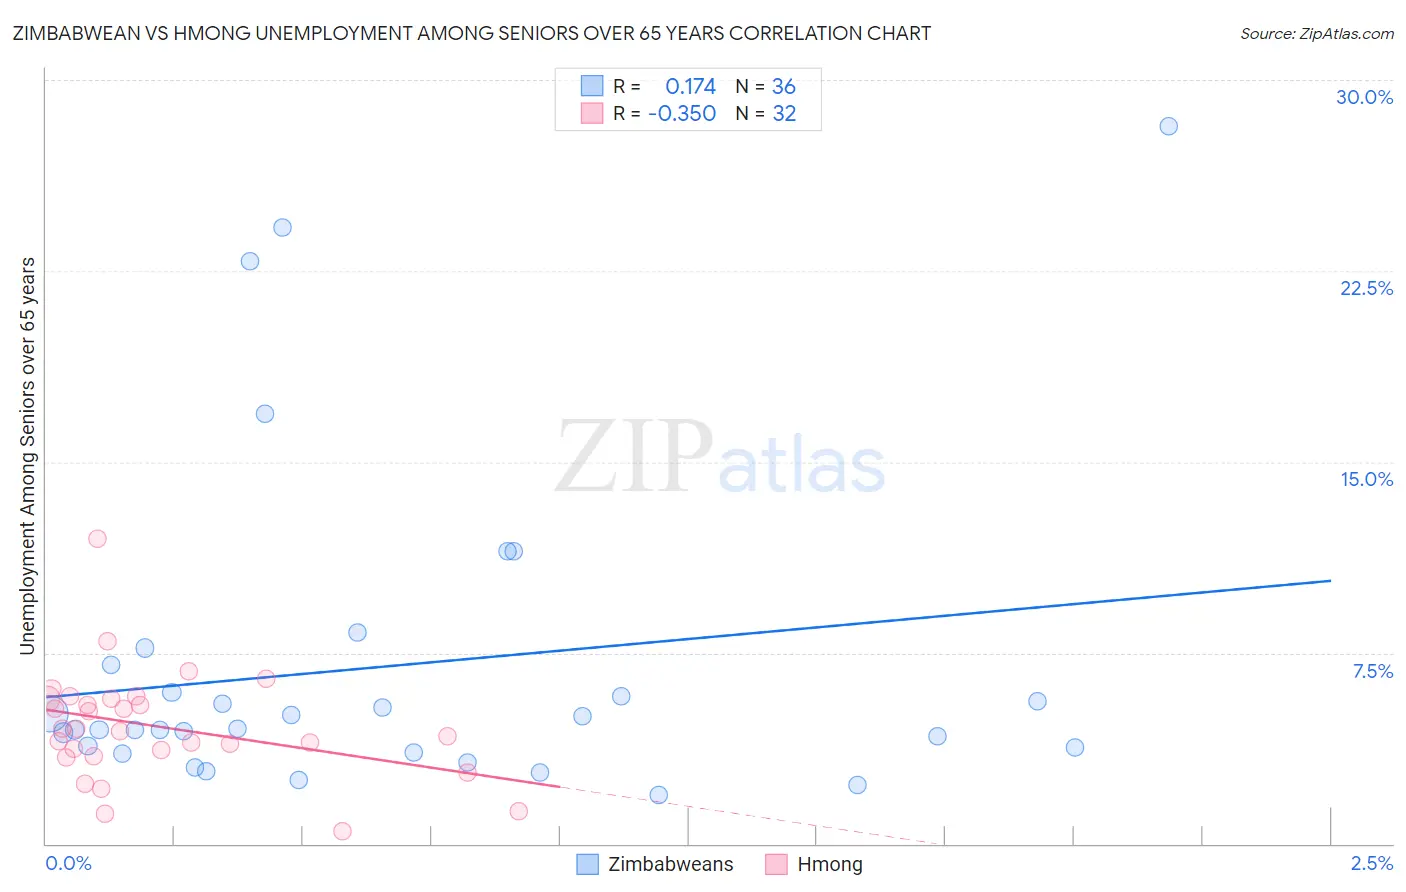
Zimbabwean vs Hmong Unemployment Among Seniors over 65 years Correlation Chart
The statistical analysis conducted on geographies consisting of 67,931,218 people shows a poor positive correlation between the proportion of Zimbabweans and unemployment rate amomg seniors over the age of 65 in the United States with a correlation coefficient (R) of 0.174 and weighted average of 5.6%. Similarly, the statistical analysis conducted on geographies consisting of 24,334,539 people shows a mild negative correlation between the proportion of Hmong and unemployment rate amomg seniors over the age of 65 in the United States with a correlation coefficient (R) of -0.350 and weighted average of 4.2%, a difference of 31.4%.
Unemployment Among Seniors over 65 years Correlation Summary
| Measurement | Zimbabwean | Hmong |
| Minimum | 1.9% | 0.50% |
| Maximum | 28.2% | 12.0% |
| Range | 26.3% | 11.5% |
| Mean | 7.0% | 4.6% |
| Median | 4.5% | 4.5% |
| Interquartile 25% (IQ1) | 3.7% | 3.6% |
| Interquartile 75% (IQ3) | 6.5% | 5.7% |
| Interquartile Range (IQR) | 2.8% | 2.2% |
| Standard Deviation (Sample) | 6.3% | 2.2% |
| Standard Deviation (Population) | 6.2% | 2.1% |
Similar Demographics by Unemployment Among Seniors over 65 years
Demographics Similar to Zimbabweans by Unemployment Among Seniors over 65 years
In terms of unemployment among seniors over 65 years, the demographic groups most similar to Zimbabweans are Guyanese (5.6%, a difference of 0.050%), Immigrants from West Indies (5.6%, a difference of 0.14%), Hispanic or Latino (5.6%, a difference of 0.20%), Yaqui (5.5%, a difference of 0.26%), and Cape Verdean (5.5%, a difference of 0.27%).
| Demographics | Rating | Rank | Unemployment Among Seniors over 65 years |
| Immigrants | Venezuela | 0.0 /100 | #293 | Tragic 5.5% |
| Armenians | 0.0 /100 | #294 | Tragic 5.5% |
| Cheyenne | 0.0 /100 | #295 | Tragic 5.5% |
| Cape Verdeans | 0.0 /100 | #296 | Tragic 5.5% |
| Yaqui | 0.0 /100 | #297 | Tragic 5.5% |
| Immigrants | West Indies | 0.0 /100 | #298 | Tragic 5.6% |
| Guyanese | 0.0 /100 | #299 | Tragic 5.6% |
| Zimbabweans | 0.0 /100 | #300 | Tragic 5.6% |
| Hispanics or Latinos | 0.0 /100 | #301 | Tragic 5.6% |
| Guatemalans | 0.0 /100 | #302 | Tragic 5.6% |
| Immigrants | Latin America | 0.0 /100 | #303 | Tragic 5.6% |
| Liberians | 0.0 /100 | #304 | Tragic 5.6% |
| Mexicans | 0.0 /100 | #305 | Tragic 5.6% |
| Ecuadorians | 0.0 /100 | #306 | Tragic 5.6% |
| Portuguese | 0.0 /100 | #307 | Tragic 5.6% |
Demographics Similar to Hmong by Unemployment Among Seniors over 65 years
In terms of unemployment among seniors over 65 years, the demographic groups most similar to Hmong are Fijian (4.2%, a difference of 0.28%), Chinese (4.2%, a difference of 0.91%), Sudanese (4.4%, a difference of 4.0%), Chickasaw (4.4%, a difference of 4.1%), and Immigrants from Cuba (4.5%, a difference of 5.4%).
| Demographics | Rating | Rank | Unemployment Among Seniors over 65 years |
| Chinese | 100.0 /100 | #1 | Exceptional 4.2% |
| Hmong | 100.0 /100 | #2 | Exceptional 4.2% |
| Fijians | 100.0 /100 | #3 | Exceptional 4.2% |
| Sudanese | 100.0 /100 | #4 | Exceptional 4.4% |
| Chickasaw | 100.0 /100 | #5 | Exceptional 4.4% |
| Immigrants | Cuba | 100.0 /100 | #6 | Exceptional 4.5% |
| Immigrants | Congo | 100.0 /100 | #7 | Exceptional 4.5% |
| Tsimshian | 100.0 /100 | #8 | Exceptional 4.5% |
| Indonesians | 100.0 /100 | #9 | Exceptional 4.5% |
| Immigrants | Zaire | 100.0 /100 | #10 | Exceptional 4.5% |
| Comanche | 100.0 /100 | #11 | Exceptional 4.6% |
| Osage | 100.0 /100 | #12 | Exceptional 4.6% |
| Cubans | 100.0 /100 | #13 | Exceptional 4.6% |
| Menominee | 100.0 /100 | #14 | Exceptional 4.6% |
| Lumbee | 100.0 /100 | #15 | Exceptional 4.6% |