Zimbabwean vs Guatemalan Unemployment Among Ages 25 to 29 years
COMPARE
Zimbabwean
Guatemalan
Unemployment Among Ages 25 to 29 years
Unemployment Among Ages 25 to 29 years Comparison
Zimbabweans
Guatemalans
6.4%
UNEMPLOYMENT AMONG AGES 25 TO 29 YEARS
93.5/ 100
METRIC RATING
94th/ 347
METRIC RANK
7.1%
UNEMPLOYMENT AMONG AGES 25 TO 29 YEARS
0.9/ 100
METRIC RATING
245th/ 347
METRIC RANK
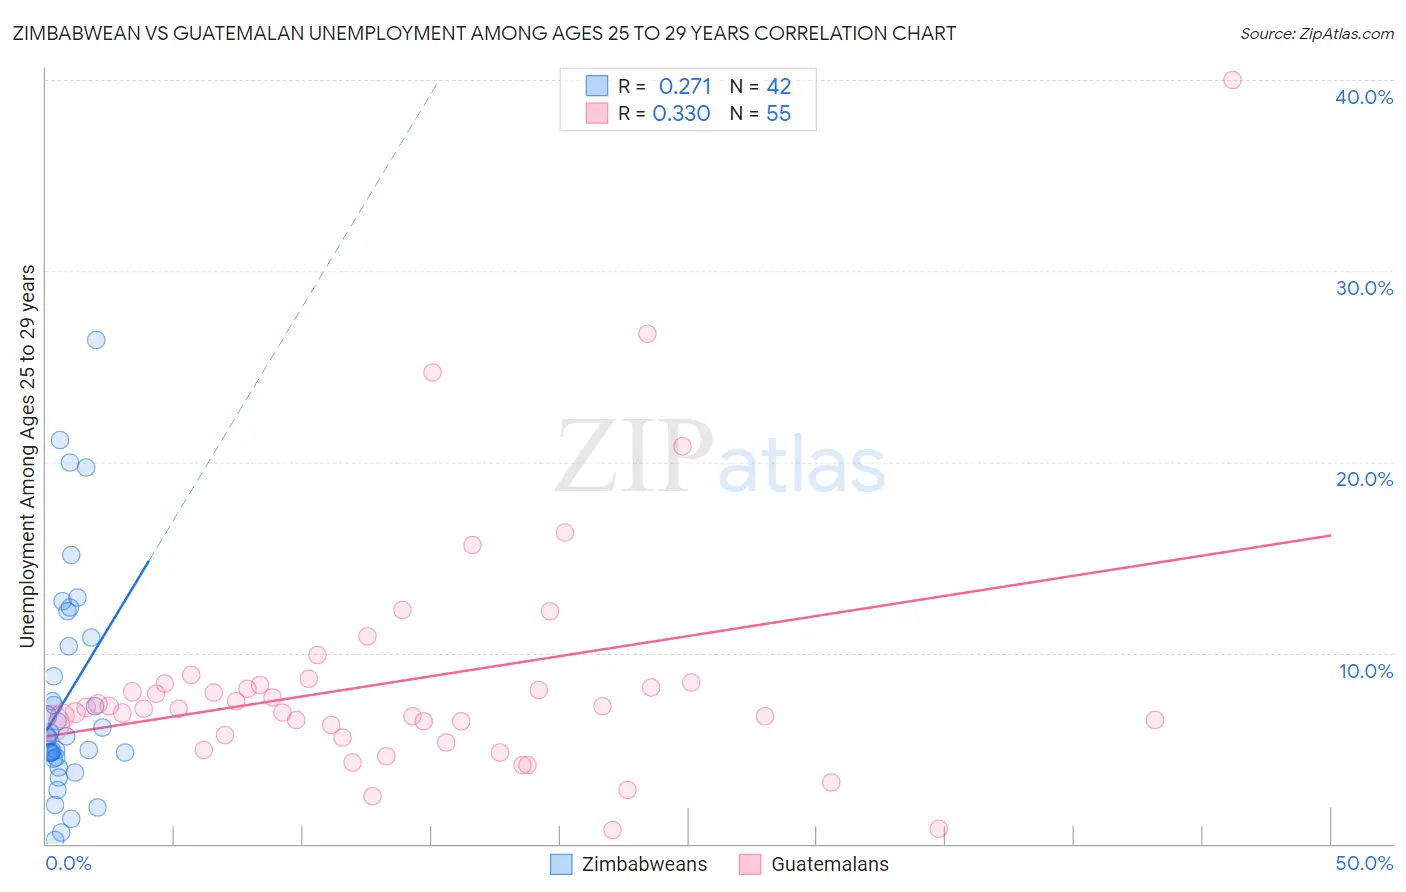
Zimbabwean vs Guatemalan Unemployment Among Ages 25 to 29 years Correlation Chart
The statistical analysis conducted on geographies consisting of 68,469,968 people shows a weak positive correlation between the proportion of Zimbabweans and unemployment rate among population between the ages 25 and 29 in the United States with a correlation coefficient (R) of 0.271 and weighted average of 6.4%. Similarly, the statistical analysis conducted on geographies consisting of 390,290,903 people shows a mild positive correlation between the proportion of Guatemalans and unemployment rate among population between the ages 25 and 29 in the United States with a correlation coefficient (R) of 0.330 and weighted average of 7.1%, a difference of 11.8%.
Unemployment Among Ages 25 to 29 years Correlation Summary
| Measurement | Zimbabwean | Guatemalan |
| Minimum | 0.20% | 0.70% |
| Maximum | 26.4% | 40.0% |
| Range | 26.2% | 39.3% |
| Mean | 7.6% | 8.6% |
| Median | 5.6% | 7.1% |
| Interquartile 25% (IQ1) | 4.5% | 5.7% |
| Interquartile 75% (IQ3) | 10.3% | 8.4% |
| Interquartile Range (IQR) | 5.8% | 2.7% |
| Standard Deviation (Sample) | 5.8% | 6.5% |
| Standard Deviation (Population) | 5.8% | 6.4% |
Similar Demographics by Unemployment Among Ages 25 to 29 years
Demographics Similar to Zimbabweans by Unemployment Among Ages 25 to 29 years
In terms of unemployment among ages 25 to 29 years, the demographic groups most similar to Zimbabweans are Immigrants from North Macedonia (6.4%, a difference of 0.050%), Australian (6.4%, a difference of 0.050%), Egyptian (6.4%, a difference of 0.11%), Lebanese (6.4%, a difference of 0.12%), and Immigrants from Oceania (6.4%, a difference of 0.19%).
| Demographics | Rating | Rank | Unemployment Among Ages 25 to 29 years |
| Marshallese | 94.7 /100 | #87 | Exceptional 6.4% |
| Immigrants | Indonesia | 94.5 /100 | #88 | Exceptional 6.4% |
| Immigrants | Oceania | 94.1 /100 | #89 | Exceptional 6.4% |
| Lebanese | 93.9 /100 | #90 | Exceptional 6.4% |
| Egyptians | 93.9 /100 | #91 | Exceptional 6.4% |
| Immigrants | North Macedonia | 93.6 /100 | #92 | Exceptional 6.4% |
| Australians | 93.6 /100 | #93 | Exceptional 6.4% |
| Zimbabweans | 93.5 /100 | #94 | Exceptional 6.4% |
| Afghans | 92.5 /100 | #95 | Exceptional 6.4% |
| Immigrants | Brazil | 92.1 /100 | #96 | Exceptional 6.4% |
| Immigrants | Eastern Europe | 91.9 /100 | #97 | Exceptional 6.4% |
| Serbians | 91.7 /100 | #98 | Exceptional 6.4% |
| Iraqis | 91.3 /100 | #99 | Exceptional 6.4% |
| Uruguayans | 91.2 /100 | #100 | Exceptional 6.4% |
| Immigrants | Ireland | 91.1 /100 | #101 | Exceptional 6.4% |
Demographics Similar to Guatemalans by Unemployment Among Ages 25 to 29 years
In terms of unemployment among ages 25 to 29 years, the demographic groups most similar to Guatemalans are Nonimmigrants (7.1%, a difference of 0.10%), Yaqui (7.1%, a difference of 0.13%), Spanish American Indian (7.1%, a difference of 0.26%), Immigrants from Uzbekistan (7.2%, a difference of 0.40%), and Immigrants from Guatemala (7.2%, a difference of 0.41%).
| Demographics | Rating | Rank | Unemployment Among Ages 25 to 29 years |
| Hondurans | 1.8 /100 | #238 | Tragic 7.1% |
| Potawatomi | 1.3 /100 | #239 | Tragic 7.1% |
| Native Hawaiians | 1.3 /100 | #240 | Tragic 7.1% |
| Immigrants | Sierra Leone | 1.3 /100 | #241 | Tragic 7.1% |
| Spanish American Indians | 1.1 /100 | #242 | Tragic 7.1% |
| Yaqui | 1.0 /100 | #243 | Tragic 7.1% |
| Immigrants | Nonimmigrants | 0.9 /100 | #244 | Tragic 7.1% |
| Guatemalans | 0.9 /100 | #245 | Tragic 7.1% |
| Immigrants | Uzbekistan | 0.7 /100 | #246 | Tragic 7.2% |
| Immigrants | Guatemala | 0.7 /100 | #247 | Tragic 7.2% |
| Sub-Saharan Africans | 0.6 /100 | #248 | Tragic 7.2% |
| Seminole | 0.6 /100 | #249 | Tragic 7.2% |
| Delaware | 0.5 /100 | #250 | Tragic 7.2% |
| Portuguese | 0.5 /100 | #251 | Tragic 7.2% |
| Sierra Leoneans | 0.4 /100 | #252 | Tragic 7.2% |