Yup'ik vs Ghanaian Unemployment Among Ages 16 to 19 years
COMPARE
Yup'ik
Ghanaian
Unemployment Among Ages 16 to 19 years
Unemployment Among Ages 16 to 19 years Comparison
Yup'ik
Ghanaians
41.0%
UNEMPLOYMENT AMONG AGES 16 TO 19 YEARS
0.0/ 100
METRIC RATING
347th/ 347
METRIC RANK
19.8%
UNEMPLOYMENT AMONG AGES 16 TO 19 YEARS
0.0/ 100
METRIC RATING
285th/ 347
METRIC RANK
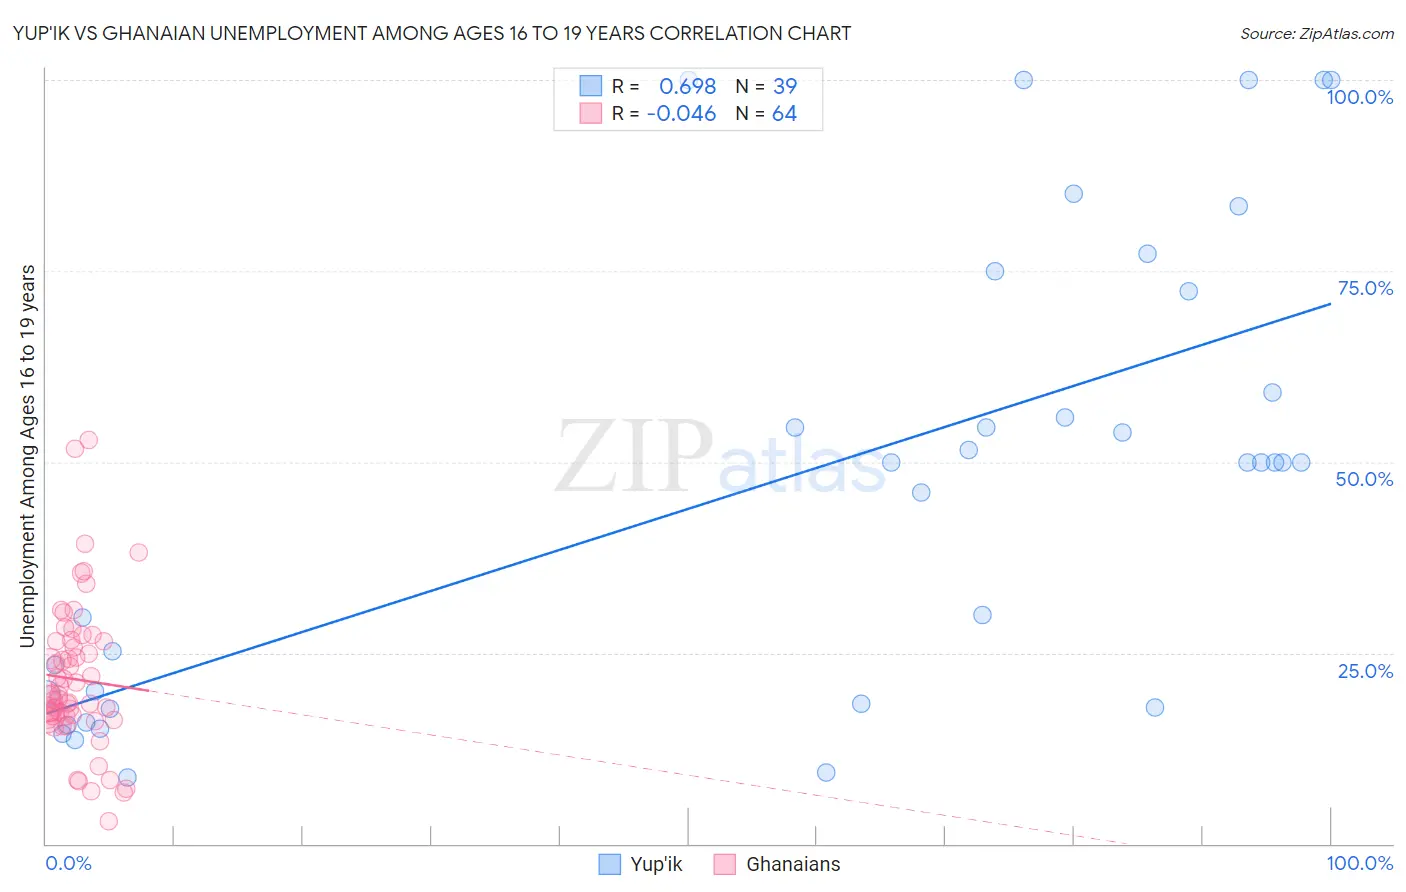
Yup'ik vs Ghanaian Unemployment Among Ages 16 to 19 years Correlation Chart
The statistical analysis conducted on geographies consisting of 39,366,389 people shows a significant positive correlation between the proportion of Yup'ik and unemployment rate among population between the ages 16 and 19 in the United States with a correlation coefficient (R) of 0.698 and weighted average of 41.0%. Similarly, the statistical analysis conducted on geographies consisting of 186,967,780 people shows no correlation between the proportion of Ghanaians and unemployment rate among population between the ages 16 and 19 in the United States with a correlation coefficient (R) of -0.046 and weighted average of 19.8%, a difference of 107.4%.
Unemployment Among Ages 16 to 19 years Correlation Summary
| Measurement | Yup'ik | Ghanaian |
| Minimum | 8.7% | 3.0% |
| Maximum | 100.0% | 52.9% |
| Range | 91.3% | 49.9% |
| Mean | 47.8% | 21.5% |
| Median | 50.0% | 19.3% |
| Interquartile 25% (IQ1) | 18.4% | 16.8% |
| Interquartile 75% (IQ3) | 72.3% | 26.5% |
| Interquartile Range (IQR) | 53.9% | 9.7% |
| Standard Deviation (Sample) | 29.6% | 9.5% |
| Standard Deviation (Population) | 29.2% | 9.5% |
Similar Demographics by Unemployment Among Ages 16 to 19 years
Demographics Similar to Yup'ik by Unemployment Among Ages 16 to 19 years
In terms of unemployment among ages 16 to 19 years, the demographic groups most similar to Yup'ik are Yuman (37.4%, a difference of 9.5%), Hopi (30.7%, a difference of 33.6%), Colville (29.7%, a difference of 38.1%), Navajo (29.0%, a difference of 41.1%), and Inupiat (28.1%, a difference of 46.0%).
| Demographics | Rating | Rank | Unemployment Among Ages 16 to 19 years |
| Paiute | 0.0 /100 | #333 | Tragic 24.4% |
| Guyanese | 0.0 /100 | #334 | Tragic 24.8% |
| Arapaho | 0.0 /100 | #335 | Tragic 25.2% |
| Kiowa | 0.0 /100 | #336 | Tragic 25.2% |
| Immigrants | Guyana | 0.0 /100 | #337 | Tragic 25.5% |
| Immigrants | St. Vincent and the Grenadines | 0.0 /100 | #338 | Tragic 25.7% |
| Immigrants | Grenada | 0.0 /100 | #339 | Tragic 25.7% |
| Crow | 0.0 /100 | #340 | Tragic 26.2% |
| Puerto Ricans | 0.0 /100 | #341 | Tragic 27.5% |
| Inupiat | 0.0 /100 | #342 | Tragic 28.1% |
| Navajo | 0.0 /100 | #343 | Tragic 29.0% |
| Colville | 0.0 /100 | #344 | Tragic 29.7% |
| Hopi | 0.0 /100 | #345 | Tragic 30.7% |
| Yuman | 0.0 /100 | #346 | Tragic 37.4% |
| Yup'ik | 0.0 /100 | #347 | Tragic 41.0% |
Demographics Similar to Ghanaians by Unemployment Among Ages 16 to 19 years
In terms of unemployment among ages 16 to 19 years, the demographic groups most similar to Ghanaians are Bahamian (19.8%, a difference of 0.12%), Sierra Leonean (19.7%, a difference of 0.18%), Sioux (19.7%, a difference of 0.19%), Immigrants from Ghana (19.8%, a difference of 0.19%), and Dutch West Indian (19.7%, a difference of 0.24%).
| Demographics | Rating | Rank | Unemployment Among Ages 16 to 19 years |
| Africans | 0.0 /100 | #278 | Tragic 19.5% |
| Ute | 0.0 /100 | #279 | Tragic 19.6% |
| Cajuns | 0.0 /100 | #280 | Tragic 19.6% |
| Cypriots | 0.0 /100 | #281 | Tragic 19.6% |
| Dutch West Indians | 0.0 /100 | #282 | Tragic 19.7% |
| Sioux | 0.0 /100 | #283 | Tragic 19.7% |
| Sierra Leoneans | 0.0 /100 | #284 | Tragic 19.7% |
| Ghanaians | 0.0 /100 | #285 | Tragic 19.8% |
| Bahamians | 0.0 /100 | #286 | Tragic 19.8% |
| Immigrants | Ghana | 0.0 /100 | #287 | Tragic 19.8% |
| Immigrants | Azores | 0.0 /100 | #288 | Tragic 19.8% |
| Pueblo | 0.0 /100 | #289 | Tragic 19.8% |
| Immigrants | Sierra Leone | 0.0 /100 | #290 | Tragic 20.0% |
| Immigrants | Yemen | 0.0 /100 | #291 | Tragic 20.0% |
| Comanche | 0.0 /100 | #292 | Tragic 20.2% |