Yup'ik vs Choctaw Unemployment Among Youth under 25 years
COMPARE
Yup'ik
Choctaw
Unemployment Among Youth under 25 years
Unemployment Among Youth under 25 years Comparison
Yup'ik
Choctaw
23.7%
UNEMPLOYMENT AMONG YOUTH UNDER 25 YEARS
0.0/ 100
METRIC RATING
347th/ 347
METRIC RANK
12.1%
UNEMPLOYMENT AMONG YOUTH UNDER 25 YEARS
1.9/ 100
METRIC RATING
230th/ 347
METRIC RANK
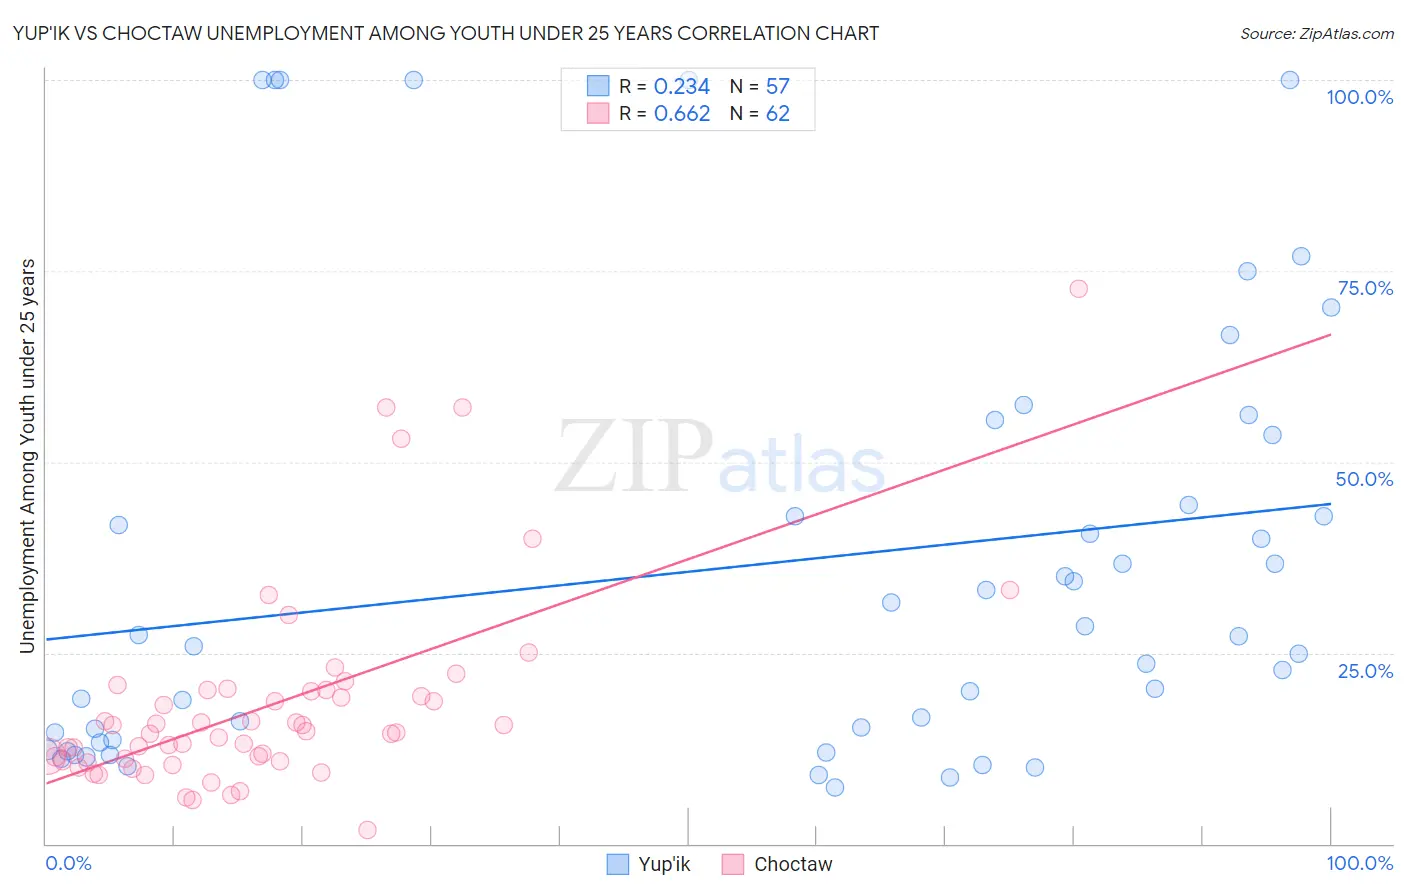
Yup'ik vs Choctaw Unemployment Among Youth under 25 years Correlation Chart
The statistical analysis conducted on geographies consisting of 39,847,863 people shows a weak positive correlation between the proportion of Yup'ik and unemployment rate among youth under the age of 25 in the United States with a correlation coefficient (R) of 0.234 and weighted average of 23.7%. Similarly, the statistical analysis conducted on geographies consisting of 266,328,025 people shows a significant positive correlation between the proportion of Choctaw and unemployment rate among youth under the age of 25 in the United States with a correlation coefficient (R) of 0.662 and weighted average of 12.1%, a difference of 96.8%.
Unemployment Among Youth under 25 years Correlation Summary
| Measurement | Yup'ik | Choctaw |
| Minimum | 7.3% | 1.8% |
| Maximum | 100.0% | 72.7% |
| Range | 92.7% | 70.9% |
| Mean | 36.3% | 18.2% |
| Median | 27.1% | 14.7% |
| Interquartile 25% (IQ1) | 13.4% | 10.9% |
| Interquartile 75% (IQ3) | 49.0% | 20.1% |
| Interquartile Range (IQR) | 35.5% | 9.2% |
| Standard Deviation (Sample) | 28.4% | 13.1% |
| Standard Deviation (Population) | 28.1% | 13.0% |
Similar Demographics by Unemployment Among Youth under 25 years
Demographics Similar to Yup'ik by Unemployment Among Youth under 25 years
In terms of unemployment among youth under 25 years, the demographic groups most similar to Yup'ik are Inupiat (22.0%, a difference of 8.0%), Hopi (21.5%, a difference of 10.6%), Crow (20.1%, a difference of 18.4%), Navajo (18.6%, a difference of 27.6%), and Puerto Rican (18.4%, a difference of 29.0%).
| Demographics | Rating | Rank | Unemployment Among Youth under 25 years |
| Guyanese | 0.0 /100 | #333 | Tragic 15.9% |
| Immigrants | Guyana | 0.0 /100 | #334 | Tragic 15.9% |
| Immigrants | St. Vincent and the Grenadines | 0.0 /100 | #335 | Tragic 16.1% |
| Pima | 0.0 /100 | #336 | Tragic 16.2% |
| Arapaho | 0.0 /100 | #337 | Tragic 16.3% |
| Yuman | 0.0 /100 | #338 | Tragic 16.3% |
| Tsimshian | 0.0 /100 | #339 | Tragic 16.5% |
| Colville | 0.0 /100 | #340 | Tragic 16.8% |
| Paiute | 0.0 /100 | #341 | Tragic 17.6% |
| Puerto Ricans | 0.0 /100 | #342 | Tragic 18.4% |
| Navajo | 0.0 /100 | #343 | Tragic 18.6% |
| Crow | 0.0 /100 | #344 | Tragic 20.1% |
| Hopi | 0.0 /100 | #345 | Tragic 21.5% |
| Inupiat | 0.0 /100 | #346 | Tragic 22.0% |
| Yup'ik | 0.0 /100 | #347 | Tragic 23.7% |
Demographics Similar to Choctaw by Unemployment Among Youth under 25 years
In terms of unemployment among youth under 25 years, the demographic groups most similar to Choctaw are Moroccan (12.1%, a difference of 0.050%), Immigrants from Fiji (12.1%, a difference of 0.060%), Immigrants from South America (12.1%, a difference of 0.10%), Immigrants from Belarus (12.1%, a difference of 0.17%), and South American Indian (12.1%, a difference of 0.19%).
| Demographics | Rating | Rank | Unemployment Among Youth under 25 years |
| Immigrants | Ireland | 3.5 /100 | #223 | Tragic 12.0% |
| Hawaiians | 3.5 /100 | #224 | Tragic 12.0% |
| Immigrants | Ukraine | 3.0 /100 | #225 | Tragic 12.0% |
| Immigrants | Israel | 2.6 /100 | #226 | Tragic 12.0% |
| Immigrants | Iran | 2.6 /100 | #227 | Tragic 12.0% |
| Immigrants | Fiji | 2.1 /100 | #228 | Tragic 12.1% |
| Moroccans | 2.1 /100 | #229 | Tragic 12.1% |
| Choctaw | 1.9 /100 | #230 | Tragic 12.1% |
| Immigrants | South America | 1.8 /100 | #231 | Tragic 12.1% |
| Immigrants | Belarus | 1.6 /100 | #232 | Tragic 12.1% |
| South American Indians | 1.6 /100 | #233 | Tragic 12.1% |
| Guatemalans | 1.4 /100 | #234 | Tragic 12.1% |
| Immigrants | Guatemala | 1.4 /100 | #235 | Tragic 12.1% |
| Immigrants | Immigrants | 1.3 /100 | #236 | Tragic 12.1% |
| Native Hawaiians | 1.3 /100 | #237 | Tragic 12.1% |