Yuman vs Soviet Union Unemployment Among Ages 25 to 29 years
COMPARE
Yuman
Soviet Union
Unemployment Among Ages 25 to 29 years
Unemployment Among Ages 25 to 29 years Comparison
Yuman
Soviet Union
11.0%
UNEMPLOYMENT AMONG AGES 25 TO 29 YEARS
0.0/ 100
METRIC RATING
334th/ 347
METRIC RANK
6.2%
UNEMPLOYMENT AMONG AGES 25 TO 29 YEARS
98.9/ 100
METRIC RATING
50th/ 347
METRIC RANK
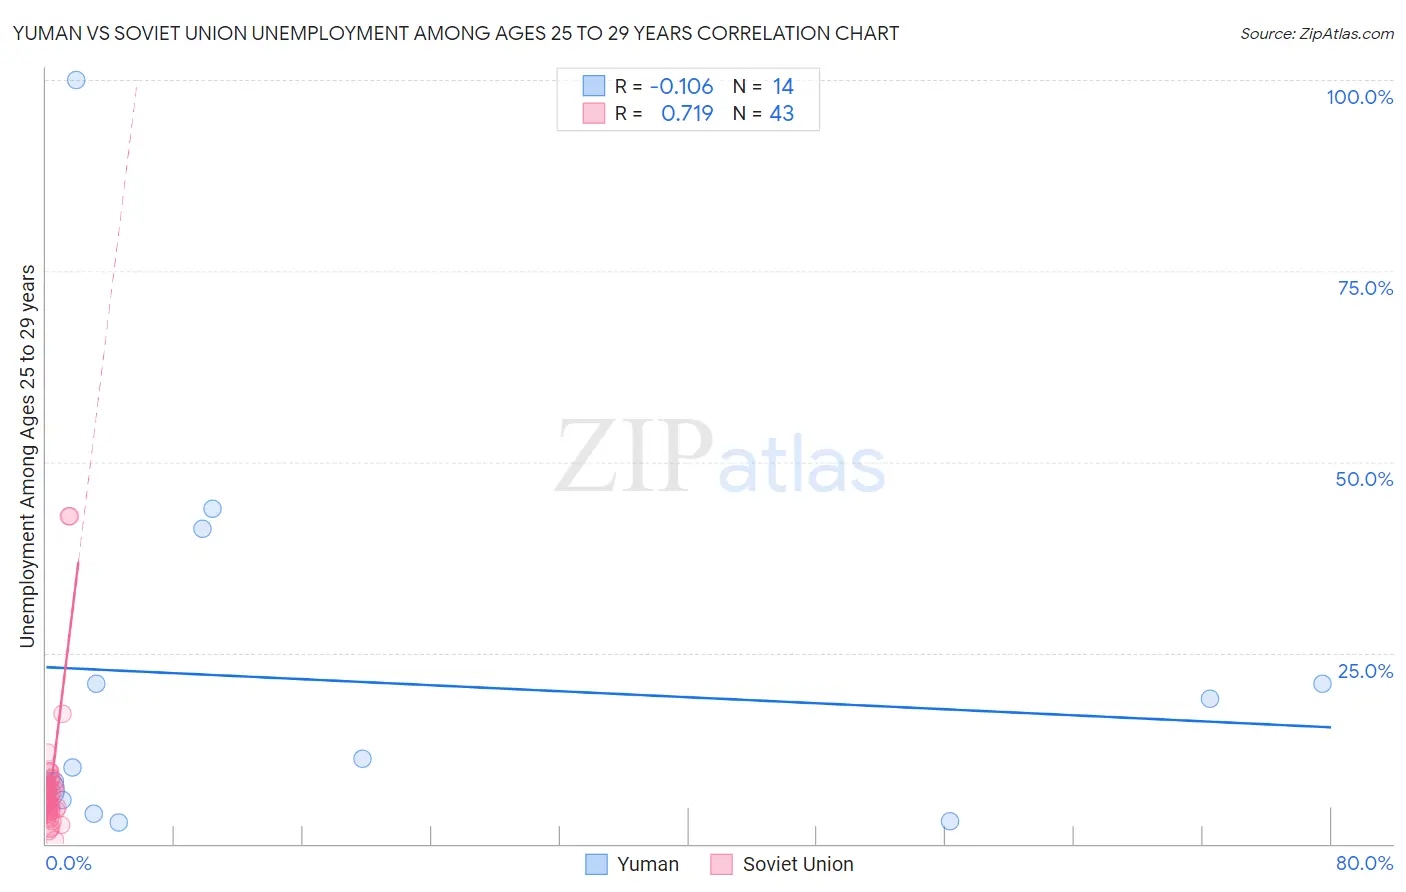
Yuman vs Soviet Union Unemployment Among Ages 25 to 29 years Correlation Chart
The statistical analysis conducted on geographies consisting of 40,399,570 people shows a poor negative correlation between the proportion of Yuman and unemployment rate among population between the ages 25 and 29 in the United States with a correlation coefficient (R) of -0.106 and weighted average of 11.0%. Similarly, the statistical analysis conducted on geographies consisting of 43,269,095 people shows a strong positive correlation between the proportion of Soviet Union and unemployment rate among population between the ages 25 and 29 in the United States with a correlation coefficient (R) of 0.719 and weighted average of 6.2%, a difference of 77.8%.
Unemployment Among Ages 25 to 29 years Correlation Summary
| Measurement | Yuman | Soviet Union |
| Minimum | 2.8% | 0.50% |
| Maximum | 100.0% | 42.9% |
| Range | 97.2% | 42.4% |
| Mean | 21.3% | 7.7% |
| Median | 10.5% | 5.8% |
| Interquartile 25% (IQ1) | 5.8% | 4.4% |
| Interquartile 75% (IQ3) | 21.0% | 8.0% |
| Interquartile Range (IQR) | 15.2% | 3.6% |
| Standard Deviation (Sample) | 26.2% | 8.4% |
| Standard Deviation (Population) | 25.3% | 8.3% |
Similar Demographics by Unemployment Among Ages 25 to 29 years
Demographics Similar to Yuman by Unemployment Among Ages 25 to 29 years
In terms of unemployment among ages 25 to 29 years, the demographic groups most similar to Yuman are Puerto Rican (11.1%, a difference of 1.1%), Alaskan Athabascan (10.8%, a difference of 2.0%), Lumbee (11.2%, a difference of 2.2%), Menominee (11.3%, a difference of 2.5%), and Pueblo (10.4%, a difference of 5.4%).
| Demographics | Rating | Rank | Unemployment Among Ages 25 to 29 years |
| Colville | 0.0 /100 | #327 | Tragic 9.2% |
| Apache | 0.0 /100 | #328 | Tragic 9.5% |
| Aleuts | 0.0 /100 | #329 | Tragic 9.7% |
| Natives/Alaskans | 0.0 /100 | #330 | Tragic 9.8% |
| Alaska Natives | 0.0 /100 | #331 | Tragic 10.2% |
| Pueblo | 0.0 /100 | #332 | Tragic 10.4% |
| Alaskan Athabascans | 0.0 /100 | #333 | Tragic 10.8% |
| Yuman | 0.0 /100 | #334 | Tragic 11.0% |
| Puerto Ricans | 0.0 /100 | #335 | Tragic 11.1% |
| Lumbee | 0.0 /100 | #336 | Tragic 11.2% |
| Menominee | 0.0 /100 | #337 | Tragic 11.3% |
| Sioux | 0.0 /100 | #338 | Tragic 11.7% |
| Pima | 0.0 /100 | #339 | Tragic 11.8% |
| Cheyenne | 0.0 /100 | #340 | Tragic 11.8% |
| Tohono O'odham | 0.0 /100 | #341 | Tragic 12.1% |
Demographics Similar to Soviet Union by Unemployment Among Ages 25 to 29 years
In terms of unemployment among ages 25 to 29 years, the demographic groups most similar to Soviet Union are Burmese (6.2%, a difference of 0.030%), German Russian (6.2%, a difference of 0.060%), Immigrants from Turkey (6.2%, a difference of 0.080%), Immigrants from Australia (6.2%, a difference of 0.12%), and Latvian (6.2%, a difference of 0.14%).
| Demographics | Rating | Rank | Unemployment Among Ages 25 to 29 years |
| Czechs | 99.2 /100 | #43 | Exceptional 6.2% |
| Mongolians | 99.2 /100 | #44 | Exceptional 6.2% |
| Venezuelans | 99.1 /100 | #45 | Exceptional 6.2% |
| Immigrants | Lithuania | 99.0 /100 | #46 | Exceptional 6.2% |
| Latvians | 99.0 /100 | #47 | Exceptional 6.2% |
| Immigrants | Australia | 99.0 /100 | #48 | Exceptional 6.2% |
| German Russians | 99.0 /100 | #49 | Exceptional 6.2% |
| Soviet Union | 98.9 /100 | #50 | Exceptional 6.2% |
| Burmese | 98.9 /100 | #51 | Exceptional 6.2% |
| Immigrants | Turkey | 98.9 /100 | #52 | Exceptional 6.2% |
| Turks | 98.8 /100 | #53 | Exceptional 6.2% |
| Swedes | 98.8 /100 | #54 | Exceptional 6.2% |
| Immigrants | Netherlands | 98.7 /100 | #55 | Exceptional 6.2% |
| Immigrants | Burma/Myanmar | 98.7 /100 | #56 | Exceptional 6.2% |
| Immigrants | Saudi Arabia | 98.6 /100 | #57 | Exceptional 6.2% |